debugger
 debugger copied to clipboard
Binary Ninja debugger
Right now, when we detach/quit from a kernel debugging session, it always cause the guest system to enter into a paused state. However, if I use WinDbg to connect to...

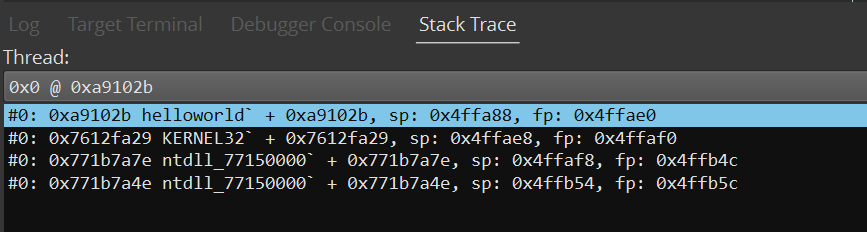
In Windows kernel debugging, when I run the command `!process 0 0 `, the Binary Ninja UI will appear to hang for ten or more seconds, then all output lines...
The arch + platform is used to create the debugger binary view. Right now, it is either copied from the currently opened view, or is provided by the user. It...
Now that we can already use the debugger without a binary view, we lack the ability to add the breakpoint at the program entry point. This is of course reasonable...
So that the user can launch the target directly from there
Right now, the debug adapter list is empty because there is no way to debug a PE on macOS. However, recently, users mention they wish to debug the PE inside...
On Linux, when gdb is running as non-root, it cannot attach to other processes with a pid. It is related to `/proc/sys/kernel/yama/ptrace_scope` stuff. We need to either use `PTRACE_TRACEME` or...
 We can see the base address of the module is not deducted from the base of module. Thanks @yrp604 for finding this!
Currently, I am using a uint64_t to represent register values. This do not work for things like xmm0. Its value gets truncated
Currently, if we print the various Python debugger objects, many of them do not give us any interesting information. For example, ```Python >>> dbg ``` We should give more information...