Improving the Aesthetics of SkewT Diagrams
What should we add?
I have always felt that the SkewT diagrams drawn in NCL are more visually appealing in terms of color schemes and structure compared to those in MetPy. Is it possible to make significant modifications to the existing style of MetPy's SkewT diagrams, to mimic the style of NCL and achieve a similar aesthetic?
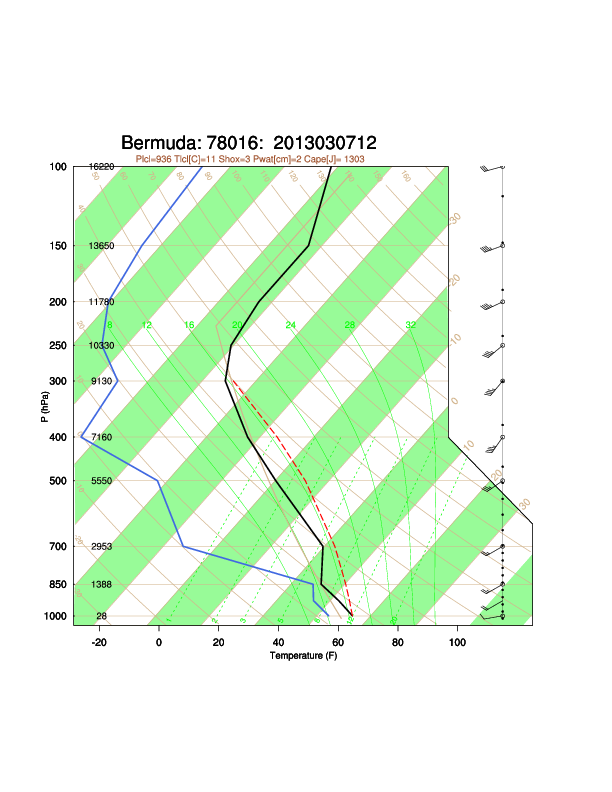
Here is an example of a SkewT diagram from NCL:
Reference
No response
Which bits in particular are you after?
Tweaks to the fonts used would likely be a straightforward modification of your matplotlibrc
The line of column data under the figure title you could add with ax.text or plt.text in a wrapper function
The green stripes between isotherms looks like plt.fill_betweenx
The colors of the various lines you could do with extra arguments or keyword arguments to plt.plot
If you work out the combination, perhaps you would like to add an example to the Gallery?
It's not like that; MetPy has a specialized plotting wrapper for SkewT diagrams. It has a dedicated SkewT object that defines the plotting methods and styles. For example:
fig = plt.figure(figsize=(9, 9))
skew = SkewT(fig, rotation=45, rect=(0.1, 0.1, 0.55, 0.85))
skew.plot(p, T, 'r')
plt.savefig('./sample.png')
I can directly call skew.plot to draw the Skew-T diagram. So what I mean is to have the default style of skew.plot adjusted to look like the NCL effect without relying on the user's own plotting skills.
I've made a demo of many of these changes in the most recent MetPy Monday video here: https://youtu.be/3iPujH33WsI