Feature request: Increase area around chart where tooltips are triggered
At the moment, it seems that the tooltips are triggered only inside the chart area. But my points can go a little bit outside the chart area. The tooltip only pops when the mouse hovers the inside portion of the point (on the inside).
It's especially apparent on the corner points; it can be seen on this example from another feature request I opened: https://codesandbox.io/s/2p8j1
Compare this to my current implementation which uses react-vis; the tooltip pops whenever you hover over any part of a point, even the corner points: https://bmaupin.github.io/langtrends/
I tried to take screenshots but the mouse pointer ended up being offset in the screenshots so I think it could end up being even more confusing. But if it would be helpful I could try a different approach to taking the screenshots.
Thanks!
For react-vis it looks like the onMouseOver event is on the circle that represents the datum point, whereas react-charts uses voronoi (class action-voronoi). I wonder if the voronoi could be enlarged to include a bit of padding around the chart? I'll see if I can figure out a workaround...
I figured out a workaround :sweat_smile:
-
I set
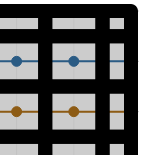
showVoronoi: truein the chart options, which showed me that the voronoi were only being set on the inside of the chart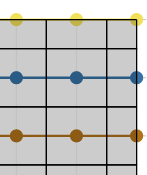
-
Workaround 1: increase the stroke width of the voronoi actions; I set it to 2x the value of the circle radius (which I have set to
5):.action-voronoi { stroke-width: 10px !important; }
-
Workaround 2: unfornately the corners still weren't covered; I worked around this with
stroke-linecap: round;:.action-voronoi { stroke-linecap: round; stroke-width: 10px !important; }