FR: Visualize stats
One feature missing is the ability to visualize work time over a week, like Zeit or Timewarrior provide. See these examples:
- https://github.com/mrusme/zeit#statistics:


Imo a visualization like Zeit does it would the most useful to me.
If anybody achieved this with with an additional program which could parse the output of watson list I'd appreciate feedback as well, but imo this should get baked into watson.
I have worked on this a bit locally and have a simple version that output stats for the last N weeks in the terminal using the "simple stackedbar plots" from https://github.com/piccolomo/plotext. They looks something like this:

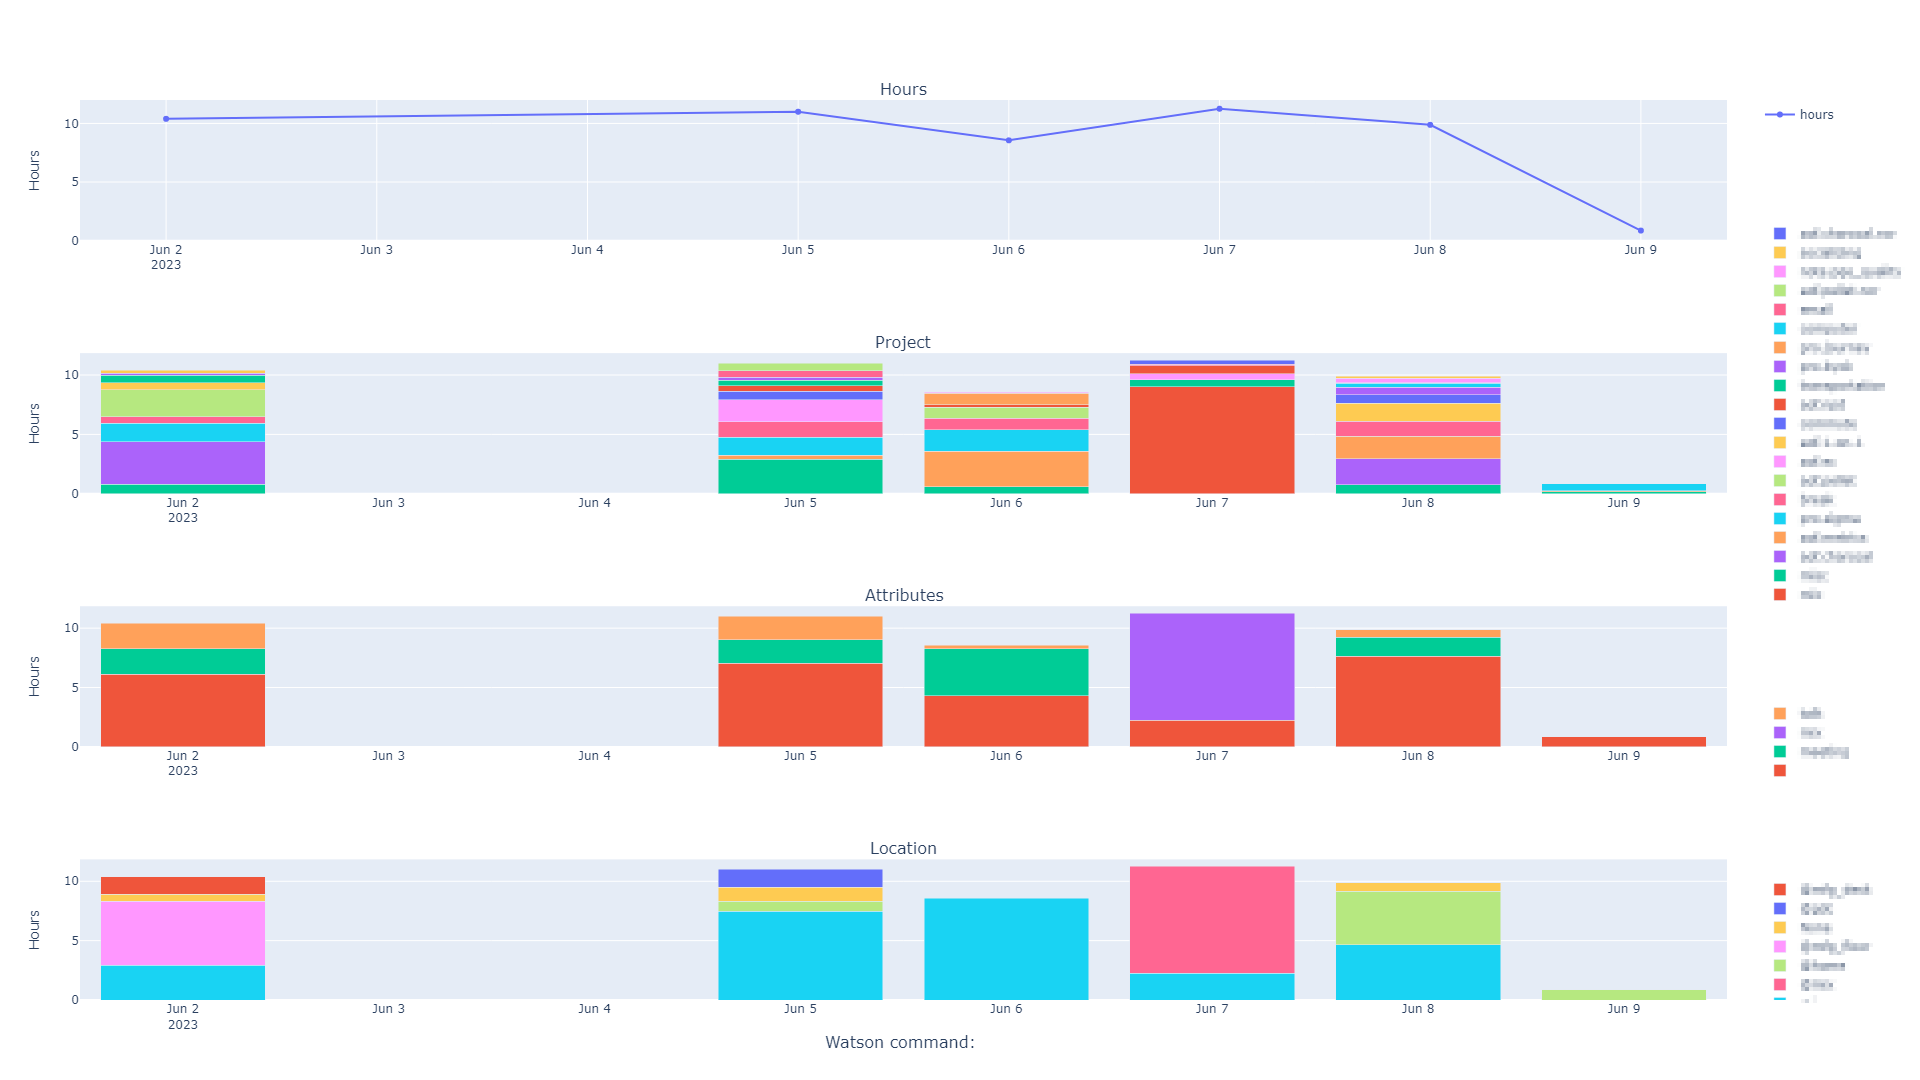
For more complicated info I have a dashboard created using Vega-Altair, but there is not code for that which is sharable at the moment, and not sure I will build that out to a general interface. I think a few easy to view summaries in terminal can go a long way. A GitHub-like heatmap would be cool to add and depends on plotext getting support for that first https://github.com/piccolomo/plotext/issues/143.
I uploaded the script to a repo so that you can have a look and help building if if you want. Note that you need to run plotext with this PR applied https://github.com/piccolomo/plotext/pull/164