[WIP] Added stump_tiles module (#248)
This is a work-in-progress pull request addressing issue #248, i.e. implementation of a method that reduces cache misses while computing the Matrix Profile using stump.
How it works right now
Let us first briefly explore how stump works right now and what's wrong with it.
Consider a time series of length 20 and a window of 6. Then we know the distance matrix will be a 15 x 15 matrix (20 - 6 + 1 = 15). Furthermore, the exclusion zone will be ±2 (np.ceil(6 / 4) = 2). Thus the distance matrix will look something like this:
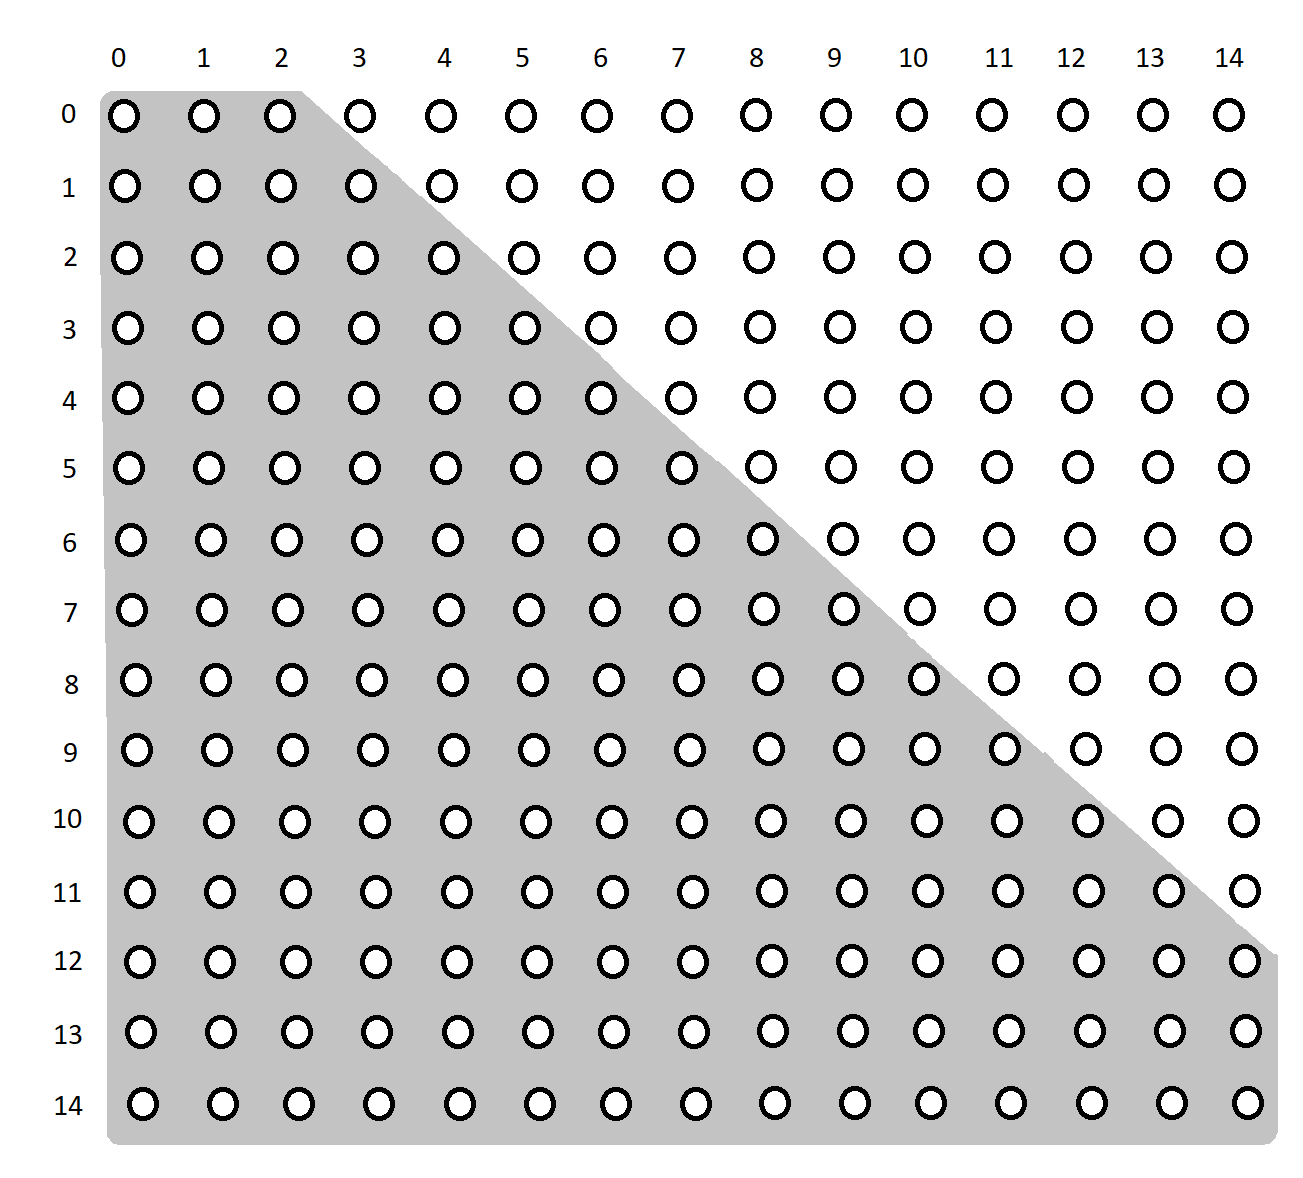
The grey area is the exclusion zone.
Currently, if this time series and window are passed into stump, each of the diagonals in the matrix will be processed one by one:
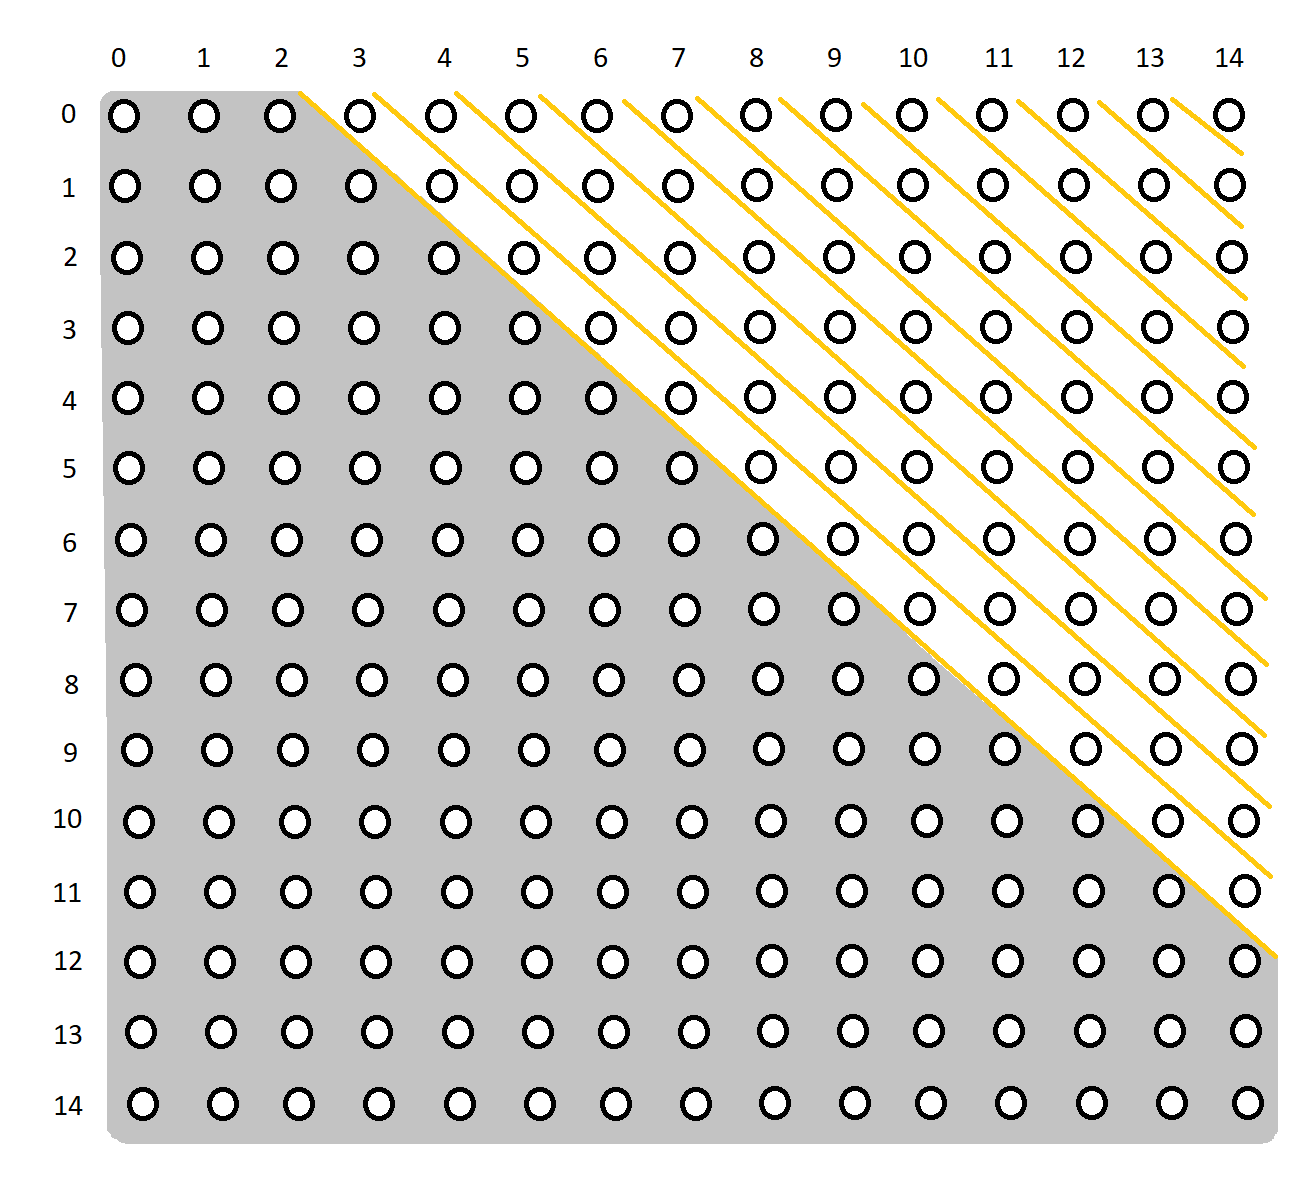
The traversal will be along the yellow dividers.
The benefit with this method is the benefit we get from computing by diagonals. Computing each distance is a lot simpler given the distance from the previous index in the diagonal. For eg, once we compute the distance for point (3, 0), we can use it to calculate the distance for point (4, 1).
The issue with this is, the cache is more likely to store points that are closer to each other, and so traversing an entire diagonal is likely to cause too many cache misses.
How we want it to work
While traversing diagonally is certainly the right approach, traversing entire diagonals will negatively affect performance. Instead, we want to split the matrix into smaller tiles, each of which will be divides into groups of diagonals.
Suppose the tile size is set to 4 and the number of diagonals to be iterated together is set to 2. Then, the distance matrix will be divided like this:
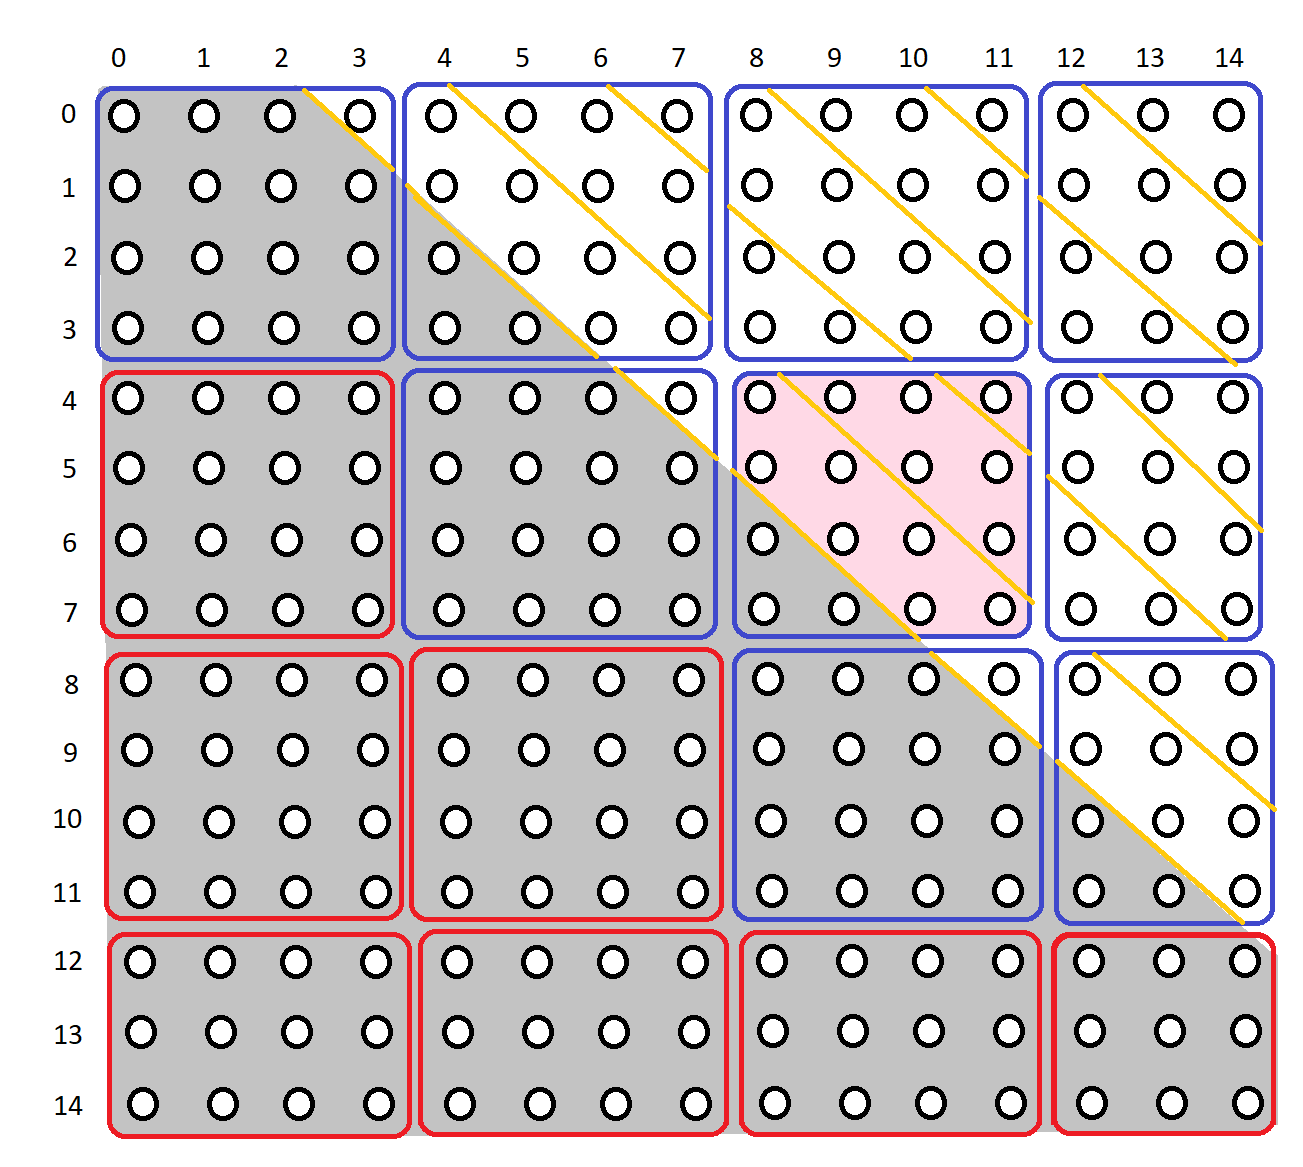
The matrix is split into 4 x 4 tiles (except near the edges). Tiles with blue borders indicate that there are distances to traverse within those tiles, tiles with red borders indicate that we should skip those tiles as there are no distances to traverse within them. Further more, each of the diagonals within the blue tiles are split into groups of 2 (or less). Each diagonal groups are traversed together.
For example, if we were to traverse the tile colored light pink, we would do so in the following order:
(8, 4)
(8, 5)
(9, 5)
(9, 6)
(10, 6)
(10, 7)
(11, 7)
(9, 4)
(10, 4)
(10, 5)
(11, 5)
(11, 6)
(11, 4)
What's done so far
The changes in the alvii147/cache_optimization branch is the first step to accomplishing this.
Two new functions were added to core.py, _get_tiles and _get_tiles_ranges, and a new module was added named stump_tiles.py.
core._get_tiles
_get_tiles(m, n_A, n_B, diags, tile_size)

Parameters
----------
m : int
    Window size

n_A : ndarray
    The length of time series `T_A`

n_B : ndarray
    The length of time series `T_B`

diags : ndarray
    The diagonal indices of interest

tile_size : int
    Maximum length of each tile
_get_tiles can be used to split the distance matrix into tiles of a given size. It returns tiles, an array of 2-column arrays, with each element representing each tile. The contents of each 2-column array are described below.
2-column array contents:

[ y_offset                x_offset            ]
[tile_height              tile_width          ]
[lower_diagonal_index     upper_diagonal_index]
[tile_weight              tile_validity       ]

x_offset, y_offset: position of the tile with respect to the distance matrix
tile_height, tile_width: dimensions of the tile
lower_diagonal_index, upper_diagonal_index: range of diagonals to be traversed within the tile
tile_weight: number of distances to be computed within the tile
tile_validity: 0 if no distances within tile are to be computed, 1 otherwise
The first 4 tiles of the distance matrix considered above should return the following result:
[[ 0  0]
 [ 4  4]
 [ 3  4]
 [ 1  1]]

[[ 0  4]
 [ 4  4]
 [-1  4]
 [13  1]]

[[ 0  8]
 [ 4  4]
 [-3  4]
 [16  1]]

[[ 0 12]
 [ 4  3]
 [-3  2]
 [12  1]]

...
core._get_tiles_ranges
_get_tiles_ranges(tiles, n_threads)

Split given `tiles` into `n_threads`.

Parameters
----------
tiles : ndarray
    An array of two column arrays representing each tile

n_threads : int
    Number of threads to split the tiles into

Returns
-------
tiles_ranges : ndarray
    A two-dimensional array representing tile indices for each thread
_get_tiles_ranges can be used to split the tiles that we obtain from _get_tiles into n_threads given threads. This is done by sorting the tiles in descending order of tile_weight, then assigning them one by one to each thread. Once we reach the end of the thread, we keep assigning the tiles to the threads in reverse order.
For example, suppose we have tiles of weights in descending order [7, 6, 5, 3, 2, 1] and we have 3 threads to divide these into. We start by assigning 7, 6, and 5 to the first three threads respectively. Then the third thread gets 3, second thread gets 2, and first thread gets 1. So the division between the threads would look something like this:
First thread: [7 1]
Second thread: [6 2]
Third thread: [5 3]
This way, the workload is most equally divided.
If we were to run _get_tiles on the previously described example, and then divide those tiles into 3 threads using _get_tiles_ranges, we would obtain the following array, where each row are the indices of the tiles assigned to each thread:
[[ 2, 11, 10, 13, 12, -1]
 [ 6,  3,  5, 14,  9, -1]
 [ 1,  7,  0, 15,  8,  4]]
NOTE: -1 is just a blank slot.
stump_tiles
The stump_tiles module is a modified version of stump. While stump calls _stump which calls _compute_diagonal, stump_tiles calls _stump_tiles, which calls _compute_tiles.
_stump_tiles will call core._get_tiles and core._get_tiles_ranges to get tiles data and pass each group of tiles to _compute_tiles in a single thread. _compute_tiles will process the given tiles and divide each tile into "chunks" of tiles that are to be processed together.
The default tile size, STUMPY_TILE_SIZE and the default number of diagonal to traverse together, STUMPY_DIAGONALS_CHUNK_SIZE are current defined in config.py.
...
STUMPY_TILE_SIZE = 1000
STUMPY_DIAGONALS_CHUNK_SIZE = 100
Testing
The only testing module added so far is test_stump_tiles.py, which is copied over and modified from test_stump.py. Use the following command to run them:
export NUMBA_DISABLE_JIT=1
export NUMBA_ENABLE_CUDASIM=1
py.test -x -W ignore::RuntimeWarning -W ignore::DeprecationWarning tests/test_stump_tiles.py

unset NUMBA_DISABLE_JIT
unset NUMBA_ENABLE_CUDASIM
py.test -x -W ignore::RuntimeWarning -W ignore::DeprecationWarning tests/test_stump_tiles.py
All test cases in test_stump_tiles are currently PASSING.
Performance
Currently stump_tiles performs very poorly on relatively smaller time series, and marginally faster on relatively larger ones. Outlined below are the performances comparisons stump and stump_tiles for different time series lengths.
| Time Series Length | Window Size m |
stump Performance (seconds) |
stump_tiles Performance (seconds) |
Percentage Improvement |
|---|---|---|---|---|
| 1000 | 10 | 0.016 | 0.016 | 0.0% |
| 2500 | 10 | 0.016 | 0.031 | -100.0% |
| 5000 | 10 | 0.06 | 0.078 | -30.77% |
| 10000 | 10 | 0.269 | 0.219 | 18.61% |
| 25000 | 10 | 1.533 | 1.366 | 10.91% |
| 50000 | 10 | 6.262 | 5.206 | 16.87% |
| 100000 | 10 | 25.189 | 20.589 | 18.27% |
| 200000 | 10 | 104.818 | 84.124 | 19.74% |
| 250000 | 10 | 164.197 | 130.789 | 20.35% |
You may use the following script for testing performance:
import stumpy
import numpy as np
import numpy.testing as npt
import time

def performance_test(m, ts_len):
    ts = np.random.rand(ts_len)

    print('\nTime series length:', ts_len)
    print('Window length:', m)

    time_elapsed = time.time()
    stump_mp = stumpy.stump(ts, m=m)
    time_elapsed = time.time() - time_elapsed
    print('stump performance (seconds):', time_elapsed)

    time_elapsed = time.time()
    stump_tiles_mp = stumpy.stump_tiles(ts, m=m)
    time_elapsed = time.time() - time_elapsed
    print('stump_tiles performance (seconds):', time_elapsed)

    npt.assert_almost_equal(stump_tiles_mp, stump_mp)

if __name__ == "__main__":
    stumpy.stump(np.random.rand(1000), m=200)
    stumpy.stump_tiles(np.random.rand(1000), m=200)

    parameters = (
        (10, 1000),
        (10, 2500),
        (10, 5000),
        (100, 10000),
        (100, 100000),
        (100, 200000),
        (100, 250000),
    )
    for param in parameters:
        performance_test(*param)
Note that the performance may vary with the values of STUMPY_TILE_SIZE and STUMPY_DIAGONALS_CHUNK_SIZE, as well as with different systems.
Okay, but what now?
There's still a lot to do, here are a few things that come to mind.
Time different components
Use the time module to time different functions that we call, namely _get_tiles, _get_tiles_ranges and _compute_tiles, find out where exactly we lose time. If any of the components take time that is exponentially increasing with the number of distances, that's a good place for possible optimization.
Optimize _get_tiles_ranges
I am almost certain _get_tiles_ranges can be simplified. Currently this function sorts the tiles by weight, which is very expensive and may not be worth it. One thing to remember, the results of _get_tiles_ranges need not be perfect, the tiles don't need to be perfectly equally split among the threads. There's no point in dividing it perfectly if we spend a lot of time doing it. A roughly equal division is also good enough if it saves time.
Optimize _compute_tiles
I will also not be surprised if _compute_tiles isn't perfectly optimized. There may be room for improvement with the way the iterations are done.
Find good values for STUMPY_TILE_SIZE and STUMPY_DIAGONALS_CHUNK_SIZE
This is a tough one, since it's system dependent. Section 4.2.2 of the Time Series Analysis with Matrix Profile on HPC Systems Paper may help with this.
Make the code NumPy and Numba friendly
Some places may use native Python functions, such as range. These should be replaced with NumPy equivalents, such as np.arange.
@seanlaw @asifmallik apologies for the lengthy pull request, lemme know if you have any questions!
Codecov Report
Merging #463 (7214d81) into main (d63963c) will increase coverage by
0.00%. The diff coverage is100.00%.
@@           Coverage Diff            @@
##             main     #463    +/-   ##
========================================
  Coverage   99.89%   99.89%
========================================
  Files          80       82     +2
  Lines       11310    11700   +390
========================================
+ Hits        11298    11688   +390
  Misses         12       12
| Impacted Files | Coverage Δ | |
|---|---|---|
| stumpy/__init__.py | 100.00% <100.00%> (ø) |
|
| stumpy/config.py | 100.00% <100.00%> (ø) |
|
| stumpy/core.py | 100.00% <100.00%> (ø) |
|
| stumpy/stump_tiles.py | 100.00% <100.00%> (ø) |
|
| tests/test_core.py | 100.00% <100.00%> (ø) |
|
| tests/test_stump_tiles.py | 100.00% <100.00%> (ø) |
Continue to review full report at Codecov.
Legend - Click here to learn more
Δ = absolute <relative> (impact),ø = not affected,? = missing dataPowered by Codecov. Last update d63963c...7214d81. Read the comment docs.
@alvii147 First off, really excellent work and thank you for providing such a detailed overview (and helpful figures too)! While I haven't gone through everything with a fine-toothed comb, I can see that the things appear to be doing what is expected. With the unit tests in place, this is a really great place to start figuring out where the bottlenecks may be. Based on your numbers above, for larger inputs, we're already seeing about a 5% improvement in speed without having optimized the STUMPY_TILE_SIZE or STUMPY_DIAGONALS_CHUNK_SIZE yet. This is great!
Now that things look stable, one would have to really spend some time making tweaks and trying to figure out where things could be made faster. Unfortunately, there are no tools that can help besides good ol' trial and error. All of the next steps that you've proposed above sound great to me but I think you should focus your time on optimizing the performance on _compute_tiles.
There is one major thing that I'd like for you to change and that is to replace all while loops with for-loops. while loops tend to be less safe (even with condition checking) and there is often an equivalent for-loop that is at least guaranteed not to accidentally run forever. From what I can tell, we should be able to tell what the bounds for the iteration is. Again, this is tremendous work and you should be proud! It would be HUGE if we could improve the performance (relative to _stump) by 20% and I have a very good feeling that you'll be able to achieve it!
@alvii147 One additional suggestion. Since you are already computing the matrix profile with both stump and stump_tiles and with larger data sizes, I'd like to recommend adding an npt.assert_almost_equals to compare the distances from both methods.
@alvii147 Also, while reading Chapter 3 of this new Masters Thesis by Felix Nilsson, they claim (without providing more detail) that STUMPY
were limited by the RAM usage to time series between 600,000 and 1,000,000 samples. Longer time series (10,000,000 - 14,000,000 in length), either caused an error or a crash well into the computation. This was insufficient for the data sets used in this project.
And they tested things using the following hardware:
CPU: Intel Core i7-8650U, 4.2 GHz, quad-core. • RAM: 16 GB (DDR4). • SWAP: 4 GB. • Storage: 500 GB SSD.
On my laptop, for 10,000,000 data points, it only consumed 4.27 GB of memory and, for 14,000,000 data points, it consumed ~7.09 GB of memory. In both cases, it will take a ton of time to run to completion (I did not do this) but I believe that the memory usage should be constant once we start computing diagonals and it should not increase in memory.
In your exploration, it may be valuable to check and see if the memory usage is "more" efficient using tiling? I know that users may not have a lot of RAM on their laptops so both a fast and memory efficient implementation are good justifications (e.g., using 25% less memory than stump). Just a thought. I don't mean to be distracting as this is really a minor point!
@seanlaw thanks for your feedback! I've added a few small changes here and there and have managed to improve the speed a bit. Here's a quick overview of what was changed:
- converted
whileloops toforloops - replaced
enumeratewithrange - replaced
lenwithrange(*.shape[0]) - replaced
np.int64asdtypewithnp.uint64where indices are stored - added
test_stump_tiles_large_time_seriesintest_stump_tilesto include coverage of computation with more than one tile
And here's a quick summary things I tried and didn't work out:
- tried replacing
rangewithnp.arange, but it was slower since it needed to build a new array - tried to make the index arrays work with
np.int64instead ofnp.uint64to avoid type issues, but somehow this was very costly. As soon as I did that,stump_tilesstarted taking longer thanstump, not sure why. - tried simplifying
_get_tiles_rangesby not sorting and having faith in the order that it came in. It didn't do too bad. But sorting it made it marginally faster.
Tested performance again, and this was the result:
time series length:       1000
window length:            10
stump performance:        0.016s
stump_tiles performance:  0.016s
% speed improvement:      0.0%

time series length:       2500
window length:            10
stump performance:        0.016s
stump_tiles performance:  0.031s
% speed improvement:      -100.0%

time series length:       5000
window length:            10
stump performance:        0.06s
stump_tiles performance:  0.078s
% speed improvement:      -30.77%

time series length:       10000
window length:            10
stump performance:        0.269s
stump_tiles performance:  0.219s
% speed improvement:      18.61%

time series length:       25000
window length:            10
stump performance:        1.533s
stump_tiles performance:  1.366s
% speed improvement:      10.91%

time series length:       50000
window length:            10
stump performance:        6.262s
stump_tiles performance:  5.206s
% speed improvement:      16.87%

time series length:       100000
window length:            10
stump performance:        25.189s
stump_tiles performance:  20.589s
% speed improvement:      18.27%

time series length:       200000
window length:            10
stump performance:        104.818s
stump_tiles performance:  84.124s
% speed improvement:      19.74%

time series length:       250000
window length:            10
stump performance:        164.197s
stump_tiles performance:  130.789s
% speed improvement:      20.35%
Looks good so far! But I suspect there's more we can do!
I think you should focus your time on optimizing the performance on
_compute_tiles
I actually haven't started this yet. I will get to this soon.
There is one major thing that I'd like for you to change and that is to replace all while loops with for-loops
Done!
Since you are already computing the matrix profile with both
stumpandstump_tilesand with larger data sizes, I'd like to recommend adding annpt.assert_almost_equalsto compare the distances from both methods
Yepp, been doing that. It's in the "performance test" example I've included above.
In your exploration, it may be valuable to check and see if the memory usage is "more" efficient using tiling?
Aghh this is where I bring bad news...
| Time Series Length | stump Memory Usage |
stump_tiles Memory Usage |
|---|---|---|
| 100000 | 164.4 MB | 168.7 MB |
| 500000 | 291.5 MB | 313.7 MB |
| 1000000 | 454.0 MB | 525.3 MB |
This makes sense though, in stump_tiles we're keeping track of multiple diagonals at a time per thread, while in stump it's always just one at a time. The memory usage should be increasingly poor as the time series length increases.
Here's a quick overview of what was changed:
- converted while loops to for loops
- replaced enumerate with range
- replaced len with range(*.shape[0])
- replaced np.int64 as dtype with np.uint64 where indices are stored
- added test_stump_tiles_large_time_series in test_stump_tiles to include coverage of computation with more than one tile
It only took these changes to get a 20% speed improvement? That is both great and really surprising as they don't seem like they should take that much time. Hopefully, you're not constantly allocating memory (i.e., creating new arrays) in _compute_tiles.
Aghh this is where I bring bad news... This makes sense though, in stump_tiles we're keeping track of multiple diagonals at a time per thread, while in stump it's always just one at a time. The memory usage should be increasingly poor as the time series length increases.
I'm confused (and should probably go look at the code) but I don't understand what you mean by "keeping track of multiple diagonals". Wouldn't you just use a for-loop to iterate across each chunk of diagonals? I can see that you may be storing the last cov within the diagonal and that could take up some memory but it should not grow if the chunk_size does not change (i.e., the chunk_size should be constant and does not grow with the size of the time series length).
That is both great and really surprising as they don't seem like they should take that much time.
You know, it's been really strange experimenting with these. I am not too sure what caused this increase, but I do remember seeing a large boost when I changed index arrays dtype from np.int64 to np.uint64. It was weird. Maybe I'm doing something wrong. It'll be clear if someone else tries it out.
I can see that you may be storing the last
covwithin the diagonal and that could take up some memory but it should not grow if thechunk_sizedoes not change.
Actually, yea you're right, my bad. There is a constant number of threads, and a constant number of cov values being saved per thread. I think the memory is coming from saving the tiles data that we obtain when running _get_tiles. Each tile has a 4 x 2 array of data, and so as the number of tiles gets higher, more memory is used.
Hint for chunk_size and tile_size :
Choose a power of 2 value, such that the local tile / chunk fits into a cache type inside the CPU.
Cache Line < L1 < L2 < L3
num_elements = cache_size_per_core / size_of_float64
http://igoro.com/archive/gallery-of-processor-cache-effects/
However, the optimum value depends on the used CPU.
Actually, yea you're right, my bad. There is a constant number of threads, and a constant number of cov values being saved per thread. I think the memory is coming from saving the tiles data that we obtain when running _get_tiles. Each tile has a 4 x 2 array of data, and so as the number of tiles gets higher, more memory is used.
Okay. That makes more sense.
tried simplifying _get_tiles_ranges by not sorting and having faith in the order that it came in. It didn't do too bad. But sorting it made it marginally faster.
Since sorting only happens once, the cost of sorting should be small relative to _compute_tiles so I doubt that you'll get a significant speed boost unless you are sorting multiple times.
Hint for chunk_size and tile_size : Choose a power of 2 value, such that the local tile / chunk fits into a cache type inside the CPU. Cache Line < L1 < L2 < L3 num_elements = cache_size_per_core / size_of_float64
Thanks for the tip @JaKasb! We welcome any other suggestions that you may have on both the implementation and ideas.
@alvii147 In your timing tables above, would you mind also providing the hardware that you are using to generate those numbers?
Also, in case it isn't obvious, there is one other major benefit to computing diagonals within a tile rather than very long diagonals across the whole length of the distance matrix and that is the added numerical stability. In _stump, we compute the covariance "accurately" once at the start and then we rely on essentially a "look-behind" method to compute the next distance. This is correct, in theory, but we can lose precision over time and it gets worse as the length of your time series gets longer. In _stump_tiles, we only carry that initial covariance to the end of the tile and then we always recompute the first set of covariances within the tile. Essentially, we get to "start fresh" in each tile and so any loss in precision is only carried a short distance between the start of the tile to the end of the tile. This is super beneficial! Based on your numbers, it is clear that the speed gained from reducing cache misses cost far outweighs the cost for computing covariances at the start of each time.
One last thing, can you please take a look at the distributed version of stump called stumped? Essentially, each server gets its own set of diagonals to compute and, eventually, I want to make sure that stump_tiles can also be added to stumped. I know this is vague so let me know if you have any questions.
@alvii147 In your timing tables above, would you mind also providing the hardware that you are using to generate those numbers?
Yepp, here it is:
CPU: intel i5-7200U, 2.50 GHz, dualcore RAM: 8 GB DDR4 Storage: 1TB HDD
In
_stump, we compute the covariance "accurately" once at the start and then we rely on essentially a "look-behind" method to compute the next distance. This is correct, in theory, but we can lose precision over time and it gets worse as the length of your time series gets longer.
Hadn't even thought of this!
One last thing, can you please take a look at the distributed version of
stumpcalledstumped?
Sure, I can take a look at implementing a stumped_tiles too, shouldn't be too complicated. I see stumped calls _stump in a dask client, so it's only a matter of replacing that with _stump_tiles, right?
We should also probably look into making an aamp_tiles, right? I copied over stump_tiles from stump, so the @core.non_normalized(aamp) is still there, but there should be a non-normalized version of tiles too, right?
Choose a power of 2 value, such that the local tile / chunk fits into a cache type inside the CPU.
Thanks for your feedback @JaKasb, I'll try that out. Thanks for the resource too.
Sure, I can take a look at implementing a stumped_tiles too, shouldn't be too complicated. I see stumped calls _stump in a dask client, so it's only a matter of replacing that with _stump_tiles, right?
That sounds about right. If I designed things properly before then I really, really hope so but we might need to change a few things at the worst.
We should also probably look into making an aamp_tiles, right? I copied over stump_tiles from stump, so the @core.non_normalized(aamp) is still there, but there should be a non-normalized version of tiles too, right?
Yes, definitely! aamp really mimics stump so it shouldn't be too hard once we are happy with stump_tiles. I feel like it might be worth creating a checklist at the top of this PR so that we don't drop anything.
@alvii147 When you get back to this, can you please remember to add explicit "function signatures" to your Numba functions? I revamped the entire codebase to do this in https://github.com/TDAmeritrade/stumpy/commit/4dcdc4700d9e72c1a484698126c8f14f00a559db
Please let me know if you have any questions.
@seanlaw sounds good, I'm gonna add that to my to-do list, thanks for the reminder!
Checklist (better 4 months late than never!):
- Run
stump_tilesthrough acProfileprofiler to identify where we are losing most time and improvestump_tilesaccordingly - Implement distributed version of
stump_tiles, i.e.stumped_tiles - Implement non-normalized version of
stump_tilesi.e.aamp_tiles - Add dev tutorial summarizing everything in this PR (and more)
~~@seanlaw I was also wondering, do you currently have (or have plans of including) tutorials for devs? As in short summaries of some modules and how exactly they work? If so I thought it might be useful to add a tutorial or a short document on stump_tiles once we're done with it. Let me know if that should also be at the end of our checklist.~~
Run stump_tiles through a cProfile profiler to identify where we are losing most time and improve stump_tiles accordingly
With _stump_tiles going through numba, I'm not sure much if anything will be revealed by cProfile. In other words, you won't get the line-by-line performance because the code isn't being run in Python and all you'll see if that the function was executed.
Implement distributed version of stump_tiles, i.e. stumped_tiles
Let's make sure to focus on making _stump_tiles as easy to read/maintain first. Perhaps, let's get that part reviewed and refactored before we spend time on anything else since it's the backbone.
Implement non-normalized version of stump_tiles i.e. aamp_tiles
Great!
@seanlaw I was also wondering, do you currently have (or have plans of including) tutorials for devs? As in short summaries of some modules and how exactly they work? If so I thought it might be useful to add a tutorial or a short document on stump_tiles once we're done with it. Let me know if that should also be at the end of our checklist.
Yes, I think this would be REALLY important and great. Currently, I have some dev-like tutorials (more like conceptual tutorials) that explain how certain major concepts work and the math behind them and they are also stored in docs/:
https://github.com/TDAmeritrade/stumpy/blob/main/docs/Matrix_Profile_Derivation.ipynb https://github.com/TDAmeritrade/stumpy/blob/main/docs/FLOSS_IAC_Derivation.ipynb https://github.com/TDAmeritrade/stumpy/blob/main/docs/Pearson.ipynb https://github.com/TDAmeritrade/stumpy/blob/main/docs/Welford_Review.ipynb
Of course, I recognize that these are much less about dev and more so about the math. Minimally, I think it would be valuable to capture what you've documented at the start of this PR (which I really loved and appreciated!) and, optimally, it would be extremely helpful to provide a line-by-line (or function-by-function) walkthrough of how things are being computed and, more importantly, the rationale as to why it is more efficient/better. Selfishly, for complex things like this PR, I would like to see enough documentation so that, a year from now, I can review the documentation and be fully oriented in less than a day. So, long-story-short, it would be more than welcome!
With _stump_tiles going through
numba, I'm not sure much if anything will be revealed bycProfile. In other words, you won't get the line-by-line performance because the code isn't being run in Python and all you'll see if that the function was executed.
Yepp I noticed that, I am temporarily removing numba support by commenting out the njit decorators at the moment. This should give us somewhat of an idea about where we can optimize.
Yes, I think this would be REALLY important and great. Currently, I have some dev-like tutorials (more like conceptual tutorials) that explain how certain major concepts work and the math behind them and they are also stored in
docs/
Sounds good I'm gonna add this to the checkist, it would undoubtedly be useful to summarize this PR, it's starting to get really long.
Yepp I noticed that, I am temporarily removing numba support by commenting out the njit decorators at the moment. This should give us somewhat of an idea about where we can optimize.
Please take my response below as anecdotal and not as authoritative.
I actually approached things in a similar way (i.e., removing njit) when I had first implemented the diagonal version of stump and found that some things that improved the speed in Python would decrease the speed in njit and vice versa. Ultimately, I stuck to leaving njit on and just ran timing calculations on a data set that would take 5-10 seconds to run and then see how much time was shaved off as I modified the code. It's not the best approach as it feels very esoteric and I definitely do not want to discourage you either! Perhaps you could document some best practices?
In case it matters, I've seen a few requests over the years about adding a line profiler to numba but it's been two years since the start of that conversation and it's just hard to predict/attribute/assign the performance of njit code directly to individual lines Python code since the Python code is being JIT compiled (i.e., optimizations are performed). I'm super excited to see what you find/learn!
@seanlaw I spent some time going through the code and trying to find places for improvement. I just changed the way we compute a "weight" for each tile to be more efficient. I don't see a significant difference since we only call the _get_tiles function once, but I imagine we will notice a difference for extremely large time series (which my computer is too weak to handle).
I've also been trying to put stump_tiles through a profiler, but that's been a bit challenging, mostly for the reasons you've outlined above.
Other than that, I'm not too sure where to go from here algorithm-wise. I'll keep trying to find areas for improvement, let me know if you spot any obvious inefficiencies.
@alvii147 Thanks for letting me know. I'll try to find some time to go over the code and provide some feedback.
In the meantime, maybe you can switch gears and focus on:
- The developer notebook that helps explain how things work when dealing with tiles
- Play around with using powers of 2 and see if it affects the performance
@alvii147 Interestingly enough, when I compare the performance between stumpy.stump and stumpy.stump_tiles I'm not seeing any significant difference. For my test case:
T = np.random.rand(100000)
m = 50
%timeit mp = stumpy.stump(T, m)
%timeit mp_tiles = stump_tiles(T, m)
mp = stumpy.stump(T, m)
mp_tiles = stump_tiles(T, m)
npt.assert_almost_equal(mp[:, 0], mp_tiles[:, 0])
I am seeing:
5.26 s ± 150 ms per loop (mean ± std. dev. of 7 runs, 1 loop each)
6.02 s ± 91.9 ms per loop (mean ± std. dev. of 7 runs, 1 loop each)
@seanlaw that's weird, at the very least stump_tiles should perform the same. I think this may be because the 100000 is still relatively a small time series. Maybe try with a larger series?
I ran it again on my device and here's what I got:
| Time Series Length | Window size m |
stump performance |
stump_tiles performance |
Percentage Improvement |
|---|---|---|---|---|
| 1000 | 10 | 0.0049 | 0.006 | -22.449% |
| 2500 | 10 | 0.0093 | 0.0103 | -10.753% |
| 5000 | 10 | 0.0382 | 0.033 | 13.613% |
| 10000 | 100 | 0.1309 | 0.1185 | 9.473% |
| 10000 | 100 | 0.1323 | 0.1157 | 12.547% |
| 100000 | 100 | 14.3625 | 12.8515 | 10.52% |
| 200000 | 100 | 62.8256 | 47.6733 | 24.118% |
| 250000 | 100 | 90.823 | 72.0611 | 20.658% |
Another reason could be the value of STUMPY_TILE_SIZE, which is currently set to 1000. It might be worthwhile, as you have mentioned, to experiment with powers of two. I'll take a look at that.
I will also start writing the developer's notebook as there is a LOT to cover. Do you prefer I do this in a different branch and pull request? Or do you think it should all be tied together here?
Another reason could be the value of STUMPY_TILE_SIZE, which is currently set to 1000
It does seem strange. I understand that we are running on different hardware but even for 200,000 datapoints I am getting:
29.8 s ± 1.21 s per loop (mean ± std. dev. of 7 runs, 1 loop each)
27.9 s ± 208 ms per loop (mean ± std. dev. of 7 runs, 1 loop each)
stumpy.stump_tiles is slightly faster (around 6-7%). I'll try to play with it a bit more as I am doing with within a Jupyter notebook/lab. Can you remind me what hardware specs you are running these tests on? How many threads?
I will also start writing the developer's notebook as there is a LOT to cover. Do you prefer I do this in a different branch and pull request? Or do you think it should all be tied together here?
Let's do it in a different branch+PR. I think it should be self contained or standalone anyways
I see, one more difference is I've been timing using the time module instead of the timeit module, and just been recording time.time() before and after running stump and stump_tiles to record type.
I've also been recently using a different laptop to the one I had been using before. Here are the specs for the device I'm using currently:
Processor Name: Quad-Core Intel Core i7 Processor Speed: 2.3 GHz Number of Processors: 1 Total Number of Cores: 4 L2 Cache (per Core): 512 KB L3 Cache: 8 MB Memory: 32 GB
I also repeated the timing using import time (not timeit) within a Python script (i.e., outside of Jupyter) and saw:
n = 200,000
23.014063835144043
22.42734408378601
n = 250,000
41.100703954696655
41.78920602798462
I need to try and understand the code.
Uh oh, that's not good ... I'm not sure why there is almost no difference in performance. The last straw I have is the STUMPY_TILE_SIZE and that it may need to be different for different cache specs. Even then, I'm a little surprised (and worried 😰 )
@seanlaw do you think it might be helpful to temporarily add some performance comparison code to this branch and call it from .github/workflows/github-actions.yml to see if the results are the same on github's cloud computation?
do you think it might be helpful to temporarily add some performance comparison code to this branch and call it from .github/workflows/github-actions.yml to see if the results are the same on github's cloud computation?
That might not be a bad idea so please go ahead and try it out. The only thing is that we might not have access to the parallelism since I'm guessing that Github Actions is a shared resource and so performance may vary significantly. I don't know if it matters either but I'm running my tests on an Apple M1
Alright so I just did that, looks like the performance really varies a lot.
ubuntu-latest, python 3.9:
 Time Series Length  Window Size  stump Performance  stump_tiles Performance Percentage Improvement  Accurate
               1000           10             0.0075                   0.0078                  -4.0%      True
               2500           10             0.0288                   0.0242                15.972%      True
               5000           10             0.1030                   0.0821                20.291%      True
              10000          100             0.4669                   0.2931                37.224%      True
              10000          100             0.4309                   0.3001                30.355%      True
             100000          100            39.4591                  28.6068                27.503%      True
             200000          100           156.0212                 113.7588                27.088%      True
             250000          100           243.4973                 177.5198                27.096%      True
             500000          100           976.2476                 703.5066                27.938%      True
macos-latest, python 3.9:
 Time Series Length  Window Size  stump Performance  stump_tiles Performance Percentage Improvement  Accurate
               1000           10             0.0073                   0.0094               -28.767%      True
               2500           10             0.0194                   0.0237               -22.165%      True
               5000           10             0.0616                   0.0666                -8.117%      True
              10000          100             0.2229                   0.2634                -18.17%      True
              10000          100             0.2002                   0.2166                -8.192%      True
             100000          100            23.6493                  22.2231                 6.031%      True
             200000          100            91.3561                  89.5183                 2.012%      True
             250000          100           150.7476                 144.5196                 4.131%      True
             500000          100           604.6118                 523.9018                13.349%      True
windows-latest, python 3.9:
 Time Series Length  Window Size  stump Performance  stump_tiles Performance Percentage Improvement  Accurate
               1000           10             0.0060                   0.0080               -33.333%      True
               2500           10             0.0220                   0.0240                -9.091%      True
               5000           10             0.0810                   0.0850                -4.938%      True
              10000          100             0.3180                   0.2992                 5.912%      True
              10000          100             0.3140                   0.3040                 3.185%      True
             100000          100            29.6795                  27.9629                 5.784%      True
             200000          100           117.4301                 111.3931                 5.141%      True
             250000          100           182.0253                 174.2976                 4.245%      True
             500000          100           735.5383                 692.7267                  5.82%      True
There are a few more runs with the older python versions, most of them have similar results. I'm not too sure what to conclude, let me know what you think.
(Note: Accurate just means the outputs of stump and stump_tiles were equal)