SELKS Dashboards BLANK after installation
After following all the steps without any errors i'm still not able to have any dashboards. Can you help understand why?
Do you have traffic mirrored?
The health check passes comes back all green ? (selks-health-check_stamus)
Do you have traffic mirrored? - YES - I checked with TCPDUMP. The health check passes comes back all green ? (selks-health-check_stamus) - ALL GREEN
All dashboards are blank ? Can you please share the output of
ls -lh /var/log/suricata/
It shows up as a total blank page. No menus nor nothing.
selks-user@SELKS:~$ ls -lh /var/log/suricata/
total 447M
drwxr-xr-x 2 logstash logstash 4.0K Jan 29 00:00 StatsByDate
drwxr-xr-x 2 logstash logstash 4.0K May  4  2020 certs
drwxr-xr-x 2 logstash logstash 4.0K Jan 28 02:00 core
-rw-r--r-- 1 logstash logstash 302M Jan 29 14:29 eve.json
drwxr-xr-x 2 logstash logstash 4.0K May  4  2020 files
-rw-r--r-- 1 logstash logstash 145M Jan 29 14:29 stats.log
-rw-r--r-- 1 root     root     2.3K Jan 29 02:00 suricata-start.log
-rw-r--r-- 1 root     root      58K Jan 29 02:00 suricata.log
selks-user@SELKS:~$

Did you go through the first time setup procedure ok - specifically the nginx config - (confirm if the nginx config is up to date) https://github.com/StamusNetworks/SELKS/wiki/First-time-setup#nginx-config ?
i don't have these two entries on the nginx config
cat /etc/nginx/sites-available/selks6.conf
location /bootstrap.js { proxy_pass http://127.0.0.1:5601/bootstrap.js; proxy_redirect off; }
location ~ "^/([\d]{5}/.*)" { proxy_pass http://127.0.0.1:5601/$1; proxy_redirect off; }
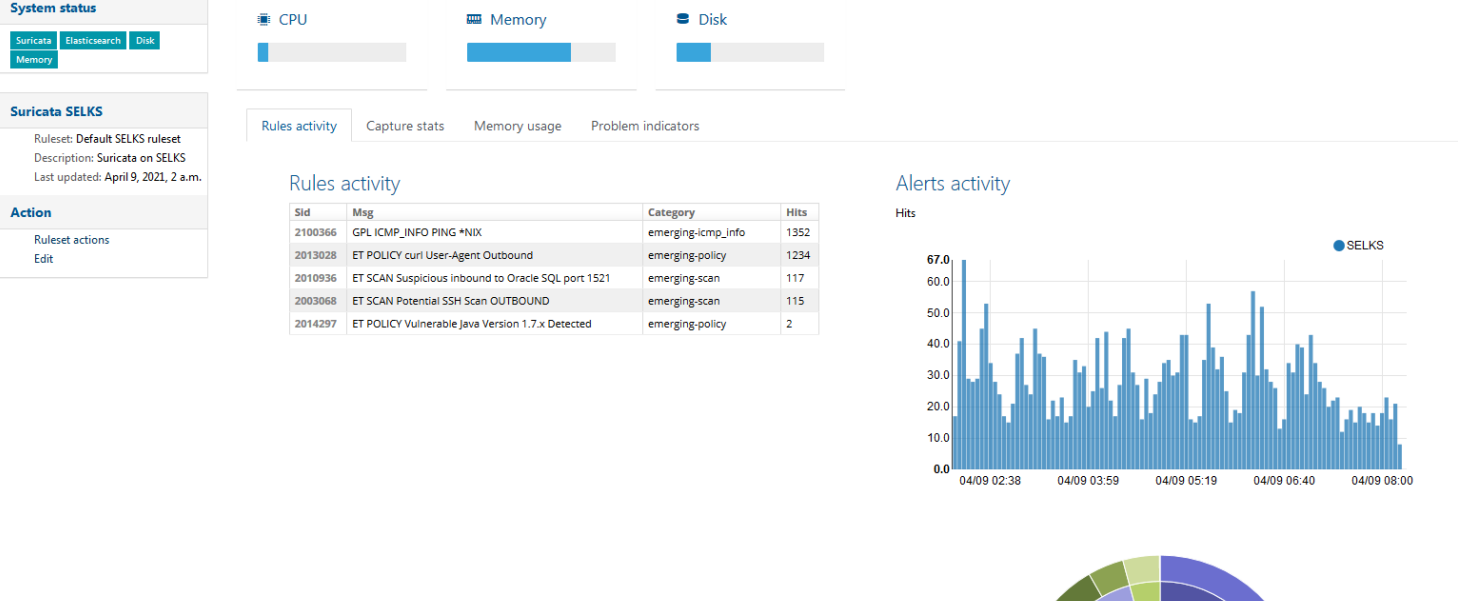
I have done above,still can't get the elegant plots in sheets of "capture stats"、“memory usage ”、“problem indicators”,when cursor overlaps would get data .
################### root@SELKS:/usr/share/python/scirius# cat /etc/nginx/sites-available/selks6.conf server { listen 127.0.0.1:80; listen 443 default_server ssl; ssl_certificate /etc/nginx/ssl/scirius.crt; ssl_certificate_key /etc/nginx/ssl/scirius.key; server_name SELKS; access_log /var/log/nginx/scirius.access.log; error_log /var/log/nginx/scirius.error.log;
# https://docs.djangoproject.com/en/dev/howto/static-files/#serving-static-files-in-production
location /static/ { # STATIC_URL
    alias /var/lib/scirius/static/; # STATIC_ROOT
    expires 30d;
}

location /media/ { # MEDIA_URL
    alias /var/lib/scirius/static/; # MEDIA_ROOT
    expires 30d;
}

location /app/moloch/ {
    proxy_pass https://127.0.0.1:8005;
    proxy_redirect off;
}

location /plugins/ {
    proxy_pass http://127.0.0.1:5601/plugins/;
    proxy_redirect off;
}

location /dlls/ {
    proxy_pass http://127.0.0.1:5601/dlls/;
    proxy_redirect off;
}

location /socket.io/ {
    proxy_pass http://127.0.0.1:5601/socket.io/;
    proxy_redirect off;
}

location /dataset/ {
    proxy_pass http://127.0.0.1:5601/dataset/;
    proxy_redirect off;
}

location /translations/ {
    proxy_pass http://127.0.0.1:5601/translations/;
    proxy_redirect off;
}

location ^~ /built_assets/ {
    proxy_pass http://127.0.0.1:5601/built_assets/;
    proxy_redirect off;
}

location /ui/ {
    proxy_pass http://127.0.0.1:5601/ui/;
    proxy_redirect off;
}
location /spaces/ { proxy_pass http://127.0.0.1:5601/spaces/; proxy_redirect off; }
location /node_modules/ { proxy_pass http://127.0.0.1:5601/node_modules/; proxy_redirect off; }
location /bootstrap.js { proxy_pass http://127.0.0.1:5601/bootstrap.js; proxy_redirect off; }
location /internal/ { proxy_pass http://127.0.0.1:5601/internal/; proxy_redirect off; }
location ~ "^/([\d]{5}/.*)" { proxy_pass http://127.0.0.1:5601/$1; proxy_redirect off; }
location / { proxy_pass http://127.0.0.1:8000; proxy_read_timeout 600; proxy_set_header Host $http_host; proxy_set_header X-Forwarded-Proto https; proxy_redirect off; }
}
root@SELKS:/usr/share/python/scirius# selks-health-check_stamus ● suricata.service - LSB: Next Generation IDS/IPS Loaded: loaded (/etc/init.d/suricata; generated) Active: active (running) since Thu 2021-04-08 15:25:08 CST; 2h 18min ago Docs: man:systemd-sysv-generator(8) Process: 15348 ExecStart=/etc/init.d/suricata start (code=exited, status=0/SUCCESS) Tasks: 246 (limit: 9830) Memory: 8.8G CGroup: /system.slice/suricata.service └─15357 /usr/bin/suricata -c /etc/suricata/suricata.yaml --pidfile /var/run/suricata.pid --af-packet -D -v --user=logstash
4月 08 15:25:08 SELKS systemd[1]: Starting LSB: Next Generation IDS/IPS... 4月 08 15:25:08 SELKS suricata[15348]: Starting suricata in IDS (af-packet) mode... done. 4月 08 15:25:08 SELKS systemd[1]: Started LSB: Next Generation IDS/IPS. ● elasticsearch.service - Elasticsearch Loaded: loaded (/lib/systemd/system/elasticsearch.service; enabled; vendor preset: enabled) Active: active (running) since Thu 2021-04-08 10:06:58 CST; 7h ago Docs: https://www.elastic.co Main PID: 1474 (java) Tasks: 291 (limit: 9830) Memory: 35.1G CGroup: /system.slice/elasticsearch.service ├─1474 /usr/share/elasticsearch/jdk/bin/java -Xshare:auto -Des.networkaddress.cache.ttl=60 -Des.networkaddress.cache.negative.ttl=10 -XX:+AlwaysPreTouch -Xss1m -Djava.awt.headless=true … └─1830 /usr/share/elasticsearch/modules/x-pack-ml/platform/linux-x86_64/bin/controller
4月 08 10:06:13 SELKS systemd[1]: Starting Elasticsearch... 4月 08 10:06:58 SELKS systemd[1]: Started Elasticsearch. ● logstash.service - logstash Loaded: loaded (/etc/systemd/system/logstash.service; enabled; vendor preset: enabled) Active: active (running) since Thu 2021-04-08 10:06:00 CST; 7h ago Main PID: 957 (java) Tasks: 168 (limit: 9830) Memory: 1.9G CGroup: /system.slice/logstash.service └─957 /usr/share/logstash/jdk/bin/java -Xms2g -Xmx2g -XX:+UseConcMarkSweepGC -XX:CMSInitiatingOccupancyFraction=75 -XX:+UseCMSInitiatingOccupancyOnly -Djava.awt.headless=true -Dfile.enc…
4月 08 10:07:01 SELKS logstash[957]: [2021-04-08T10:07:01,501][INFO ][logstash.outputs.elasticsearch][main] ES Output version determined {:es_version=>7}
4月 08 10:07:01 SELKS logstash[957]: [2021-04-08T10:07:01,503][INFO ][logstash.outputs.elasticsearch][main] ES Output version determined {:es_version=>7}
4月 08 10:07:01 SELKS logstash[957]: [2021-04-08T10:07:01,503][WARN ][logstash.outputs.elasticsearch][main] Detected a 6.x and above cluster: the type event field won't be used …{:es_version=>7}
4月 08 10:07:01 SELKS logstash[957]: [2021-04-08T10:07:01,507][WARN ][logstash.outputs.elasticsearch][main] Detected a 6.x and above cluster: the type event field won't be used …{:es_version=>7}
4月 08 10:07:16 SELKS logstash[957]: [2021-04-08T10:07:16,122][INFO ][logstash.outputs.elasticsearch][main] Using mapping template from {:path=>"/etc/logstash/elasticsearch7-template.json"}
4月 08 10:07:16 SELKS logstash[957]: [2021-04-08T10:07:16,126][INFO ][logstash.outputs.elasticsearch][main] Using mapping template from {:path=>"/etc/logstash/elasticsearch7-template.json"}
4月 08 10:07:16 SELKS logstash[957]: [2021-04-08T10:07:16,239][INFO ][logstash.outputs.elasticsearch][main] Attempting to install template {:manage_template=>{"template"=>"logstash-", "version"=…
4月 08 10:07:16 SELKS logstash[957]: [2021-04-08T10:07:16,240][INFO ][logstash.outputs.elasticsearch][main] Attempting to install template {:manage_template=>{"template"=>"logstash-", "version"=…
4月 08 10:07:16 SELKS logstash[957]: [2021-04-08T10:07:16,263][INFO ][logstash.outputs.elasticsearch][main] Installing elasticsearch template to _template/logstash
4月 08 10:07:16 SELKS logstash[957]: [2021-04-08T10:07:16,266][INFO ][logstash.outputs.elasticsearch][main] Installing elasticsearch template to _template/logstash
Hint: Some lines were ellipsized, use -l to show in full.
● kibana.service - Kibana
Loaded: loaded (/etc/systemd/system/kibana.service; disabled; vendor preset: enabled)
Active: active (running) since Thu 2021-04-08 14:25:47 CST; 3h 18min ago
Docs: https://www.elastic.co
Main PID: 9525 (node)
Tasks: 11 (limit: 9830)
Memory: 531.2M
CGroup: /system.slice/kibana.service
└─9525 /usr/share/kibana/bin/../node/bin/node /usr/share/kibana/bin/../src/cli/dist --logging.dest=/var/log/kibana/kibana.log --pid.file=/run/kibana/kibana.pid
4月 08 14:25:47 SELKS systemd[1]: Started Kibana. ● evebox.service - EveBox Server Loaded: loaded (/lib/systemd/system/evebox.service; enabled; vendor preset: enabled) Active: active (running) since Thu 2021-04-08 10:06:00 CST; 7h ago Main PID: 956 (evebox) Tasks: 49 (limit: 9830) Memory: 42.2M CGroup: /system.slice/evebox.service └─956 /usr/bin/evebox server
4月 08 10:06:00 SELKS evebox[956]: 2021-04-08 10:06:00 INFO evebox::server::main: Using temporary in-memory configuration database 4月 08 10:06:00 SELKS evebox[956]: 2021-04-08 10:06:00 INFO evebox::sqlite::init: Initializing SQLite database (configdb) 4月 08 10:06:00 SELKS evebox[956]: 2021-04-08 10:06:00 INFO evebox::sqlite::init: Updating SQLite database to schema version 1 (configdb) 4月 08 10:06:00 SELKS evebox[956]: 2021-04-08 10:06:00 ERROR evebox::server::main: Failed to get Elasticsearch version, things may not work right: error=request: error sending req…d (os error 111) 4月 08 10:06:00 SELKS evebox[956]: 2021-04-08 10:06:00 INFO evebox::server::main: Starting server on 127.0.0.1:5636, tls=false 4月 08 12:50:20 SELKS evebox[956]: 2021-04-08 12:50:20 INFO evebox::server::main: Creating anonymous session for user from Some(127.0.0.1:56584) with name selks-user 4月 08 12:58:13 SELKS evebox[956]: 2021-04-08 12:58:13 INFO evebox::server::api::login: User logged out: selks-user 4月 08 12:58:13 SELKS evebox[956]: 2021-04-08 12:58:13 INFO evebox::server::main: Creating anonymous session for user from Some(127.0.0.1:58202) with name selks-user 4月 08 13:15:14 SELKS evebox[956]: 2021-04-08 13:15:14 INFO evebox::server::main: Creating anonymous session for user from Some(127.0.0.1:59240) with name selks-user 4月 08 14:57:29 SELKS evebox[956]: 2021-04-08 14:57:29 INFO evebox::server::main: Creating anonymous session for user from Some(127.0.0.1:36402) with name selks-user Hint: Some lines were ellipsized, use -l to show in full. ● molochviewer-selks.service - Moloch Viewer Loaded: loaded (/etc/systemd/system/molochviewer-selks.service; disabled; vendor preset: enabled) Active: inactive (dead) ● molochpcapread-selks.service - Moloch Pcap Read Loaded: loaded (/etc/systemd/system/molochpcapread-selks.service; disabled; vendor preset: enabled) Active: inactive (dead)
scirius RUNNING pid 12440, uptime 2:49:52 ii elasticsearch 7.12.0 amd64 Distributed RESTful search engine built for the cloud ii elasticsearch-curator 5.8.3 amd64 Have indices in Elasticsearch? This is the tool for you!\n\nLike a museum curator manages the exhibits and collections on display, \nElasticsearch Curator helps you curate, or manage your indices. ii evebox 1:0.13.0 amd64 no description given ii kibana 7.12.0 amd64 Explore and visualize your Elasticsearch data ii kibana-dashboards-stamus 2020122001 amd64 Kibana 6 dashboard templates. ii logstash 1:7.12.0-1 amd64 An extensible logging pipeline ii moloch 2.7.1-1 amd64 Moloch Full Packet System ii scirius 3.7.0-1 amd64 Django application to manage Suricata ruleset ii suricata 1:2021030201-0stamus0 amd64 Suricata open source multi-thread IDS/IPS/NSM system.

Is it just that or no data at all - for example no protocol logs/alerts etc?
I don't think so.
####################
root@SELKS:~# curl -XGET 'http://localhost:9200/_cat/shards?v'
index shard prirep state docs store ip node
logstash-2021.04.03 0 p STARTED 16539 38.6mb 127.0.0.1 SELKS
logstash-http-2021.04.09 0 p STARTED 3179 3.3mb 127.0.0.1 SELKS
stats_v4 0 p STARTED 0 301b 127.0.0.1 SELKS
logstash-2021.04.07 0 p STARTED 16535 36.8mb 127.0.0.1 SELKS
dstats_v4 1 p STARTED 0 301b 127.0.0.1 SELKS
dstats_v4 0 p STARTED 0 301b 127.0.0.1 SELKS
.apm-custom-link 0 p STARTED 0 261b 127.0.0.1 SELKS
users_v7 0 p STARTED 2 7.7kb 127.0.0.1 SELKS
logstash-alert-2021.04.08 0 p STARTED 9044 9.1mb 127.0.0.1 SELKS
logstash-dhcp-2021.04.08 0 p STARTED 20907 2.3mb 127.0.0.1 SELKS
fields_v3 0 p STARTED 327 69.6kb 127.0.0.1 SELKS
hunts_v2 0 p STARTED 0 301b 127.0.0.1 SELKS
.kibana-event-log-7.12.0-000001 0 p STARTED 7 38kb 127.0.0.1 SELKS
logstash-snmp-2021.04.09 0 p STARTED 154 142kb 127.0.0.1 SELKS
logstash-flow-2021.04.08 0 p STARTED 911642 280.8mb 127.0.0.1 SELKS
.ds-ilm-history-5-2021.03.31-000001 0 p STARTED 127.0.0.1 SELKS
logstash-flow-2021.03.31 0 p STARTED 64 186.1kb 127.0.0.1 SELKS
logstash-anomaly-2021.04.09 0 p STARTED 5 53.7kb 127.0.0.1 SELKS
logstash-ftp-2021.04.08 0 p STARTED 77874 14mb 127.0.0.1 SELKS
logstash-2021.04.06 0 p STARTED 16327 36.9mb 127.0.0.1 SELKS
lookups_v1 0 p STARTED 0 301b 127.0.0.1 SELKS
dstats 0 p STARTED 1613 445.6kb 127.0.0.1 SELKS
logstash-2021.03.31 0 p STARTED 16044 35.4mb 127.0.0.1 SELKS
logstash-2021.04.04 0 p STARTED 16541 38.4mb 127.0.0.1 SELKS
logstash-http-2021.04.08 0 p STARTED 795971 286.6mb 127.0.0.1 SELKS
logstash-flow-2021.04.09 0 p STARTED 23830 8mb 127.0.0.1 SELKS
.kibana_7.12.0_001 0 p STARTED 77 4.4mb 127.0.0.1 SELKS
logstash-fileinfo-2021.04.08 0 p STARTED 1520553 456.2mb 127.0.0.1 SELKS
logstash-fileinfo-2021.04.09 0 p STARTED 1808 2.6mb 127.0.0.1 SELKS
.kibana_task_manager_1 0 p STARTED 5 22.2kb 127.0.0.1 SELKS
sequence_v3 0 p STARTED 1 3.1kb 127.0.0.1 SELKS
logstash-2021.04.08 0 p STARTED 16385 50.5mb 127.0.0.1 SELKS
logstash-2021.04.05 0 p STARTED 16535 38.3mb 127.0.0.1 SELKS
stats 0 p STARTED 1 25.6kb 127.0.0.1 SELKS
.async-search 0 p STARTED 0 362.9kb 127.0.0.1 SELKS
queries_v3 0 p STARTED 0 301b 127.0.0.1 SELKS
logstash-dns-2021.04.08 0 p STARTED 12315 1.7mb 127.0.0.1 SELKS
logstash-ssh-2021.04.09 0 p STARTED 2 36.5kb 127.0.0.1 SELKS
.kibana_1 0 p STARTED 1141 486.2kb 127.0.0.1 SELKS
logstash-snmp-2021.04.08 0 p STARTED 9185 2.8mb 127.0.0.1 SELKS
logstash-ftp_data-2021.04.08 0 p STARTED 26 154.5kb 127.0.0.1 SELKS
logstash-tls-2021.04.09 0 p STARTED 1901 835.5kb 127.0.0.1 SELKS
logstash-dhcp-2021.04.09 0 p STARTED 286 201.7kb 127.0.0.1 SELKS
logstash-ftp-2021.04.09 0 p STARTED 1438 451.4kb 127.0.0.1 SELKS
logstash-anomaly-2021.04.08 0 p STARTED 551 188.2kb 127.0.0.1 SELKS
.apm-agent-configuration 0 p STARTED 0 261b 127.0.0.1 SELKS
logstash-ssh-2021.04.08 0 p STARTED 79 163.2kb 127.0.0.1 SELKS
logstash-2021.04.01 0 p STARTED 16536 38.2mb 127.0.0.1 SELKS
.tasks 0 p STARTED 14 33.1kb 127.0.0.1 SELKS
.kibana_task_manager_7.12.0_001 0 p STARTED 10 2.1mb 127.0.0.1 SELKS
logstash-alert-2021.04.09 0 p STARTED 80 251.5kb 127.0.0.1 SELKS
logstash-2021.04.02 0 p STARTED 16536 39.2mb 127.0.0.1 SELKS
files_v6 1 p STARTED 1 4.8kb 127.0.0.1 SELKS
files_v6 0 p STARTED 0 301b 127.0.0.1 SELKS
logstash-2021.04.09 0 p STARTED 182 1.2mb 127.0.0.1 SELKS
logstash-tls-2021.04.08 0 p STARTED 15306 4.8mb 127.0.0.1 SELKS
It seems you have data - snmp/ftp/tls protocols plus alerts.
logstash-alert-2021.04.09           0     p      STARTED      80 251.5kb 127.0.0.1 SELKS
...
logstash-snmp-2021.04.08            0     p      STARTED    9185   2.8mb 127.0.0.1 SELKS
logstash-ftp_data-2021.04.08        0     p      STARTED      26 154.5kb 127.0.0.1 SELKS
logstash-tls-2021.04.09
Can you open the SN-ALERT dashboard in Kibana and see if it populates?
kibana not presents any selks dashborads even i reset it.
I just follow https://github.com/StamusNetworks/KTS7 to terminate it now.

ok -seem populating now. Did the first time setup finish ok and without errors? ( https://github.com/StamusNetworks/SELKS/wiki/First-time-setup#first-time-setup )
yes ,Exited with ERROR "AttributeError: 'Settings' object has no attribute 'KIBANA7_DASHBOARDS_PATH'" before I set "KIBANA7_DASHBOARDS_PATH = "/opt/selks/kibana7-dashboards/" " in /etc/scirius/local_settings.py selks-first-time-setup_stamus.log
Have you adjusted those config settings before? It should work outside the box. Can you try to reset the dashboards - https://github.com/StamusNetworks/SELKS/wiki/How-to-load-or-update-dashboards#from-scirius ?
I also encountered this error after running upgrade-selks successfully. During the upgrade process, I was asked to choose yes or no. The yes I selected for all may have something to do with this. I also noticed that the dashboard is not a blank page. Right-clicking the source code in the browser will find that there are actually a lot of html content. The dashboard just looks blank, but the elements may not be displayed. Maybe it is a compatibility issue?
I also encountered this error after running upgrade-selks successfully. During the upgrade process, I was asked to choose yes or no. The yes I selected for all may have something to do with this. I also noticed that the dashboard is not a blank page. Right-clicking the source code in the browser will find that there are actually a lot of html content. The dashboard just looks blank, but the elements may not be displayed. Maybe it is a compatibility issue?
The problem is solved, I directly replaced mine with the selks6.conf configuration you provided (https://github.com/StamusNetworks/SELKS/wiki/Kibana-did-not-load-properly)