Mismatch in sw.plot_timeseries
Hi all,
when we use a multishank probe, we observe a mismatch between the probe mapping and the order in which the channels are plotted using sw.plot_timeseries when the boolean "order_channel_by_depth=True". The Y axis of the plot does not have the channels organized based on their depth position. However, when we use a linear probe we dont have this issue. Any suggestions?
Hi @vincisLab
Could you send us the probeinterface json file so we can test?
You can use the probeinterface.io.write_probeinterface() function.
Hi @alejoe91
Here the json file. Also I added two pdf files: one with the plot of the probe and the other with the plot_timeseries with order_channel_by_depth=True.
Thanks!
extracellular_example.pdf Probe.pdf prbFile.zip
I ran into a similar issue. It's particularly apparent when plotting two recordings overlaid (e.g. filtered and filtered+CMR). Probe.json file is attached below.
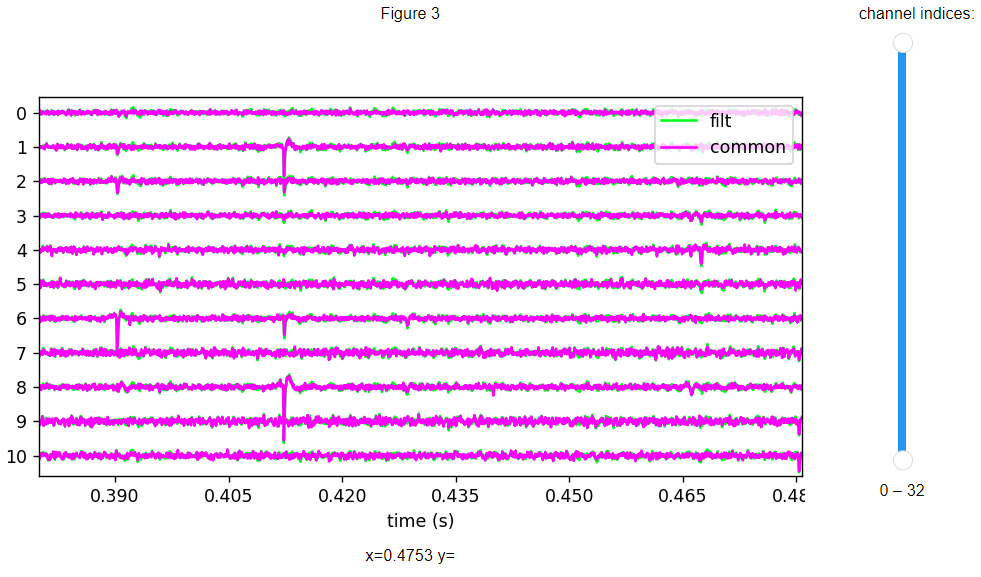
When I run:
w = si.plot_timeseries({"filt": recording_f, "common": recording_cmr},
                        clim=(-1000, 1000), order_channel_by_depth=False,show_channel_ids=True, backend="ipywidgets")
I get (zoomed in to show that the spikes match before and after CMR):
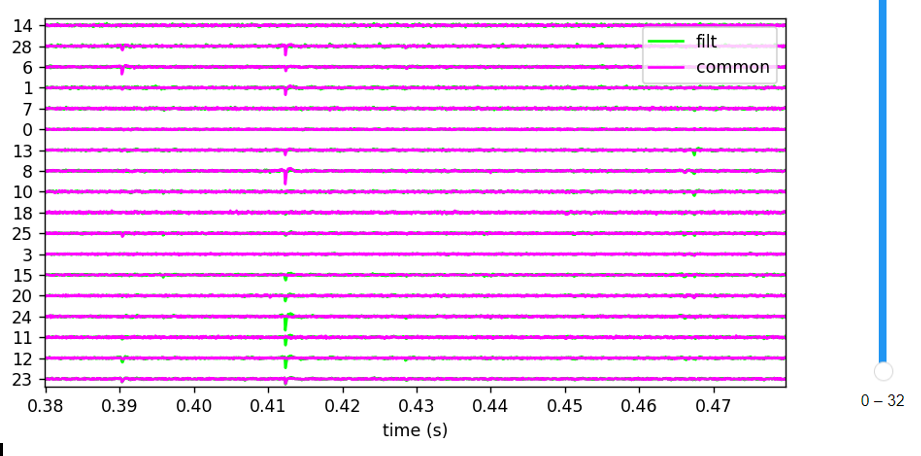
When I run:
w = si.plot_timeseries({"filt": recording_f, "common": recording_cmr},
                        clim=(-1000, 1000), order_channel_by_depth=True,show_channel_ids=True, backend="ipywidgets")
I get (notice the big spike at time 0.41 s is now on different channels in the two versions of the recording. And the channel numbers don't make sense to me):
I'm only using a single shank probe actually, but the sites are arrayed in two columns, in case that matters.
Probe.json file: probe.zip
Should be fixed by this PR: https://github.com/SpikeInterface/spikeinterface/pull/1000