gbm.auto

gbm.auto copied to clipboard
Auto: plot relationship #samples p.resolve
Could start to plot a relationship between +ve/all samples & chance of resolving
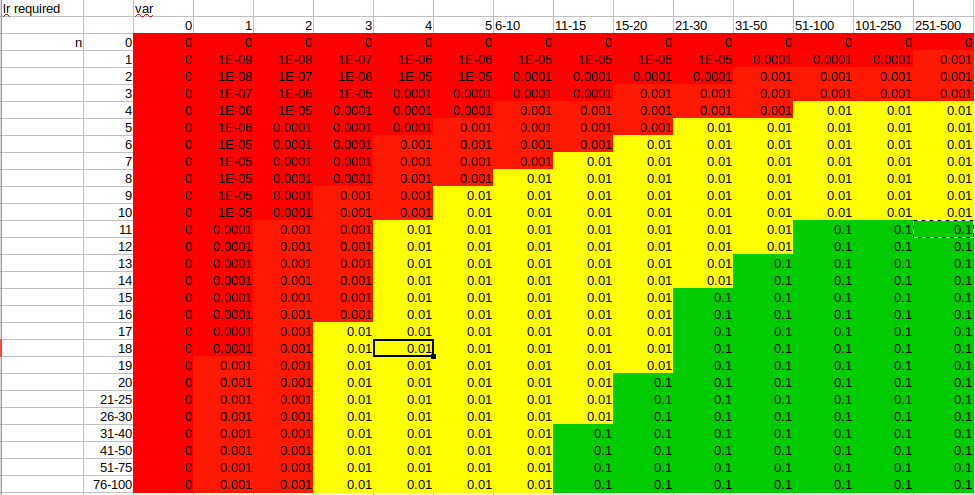
see Eric Reyier run script: not only n of (positive) samples but also variance? From my email to him: "the ability to get finetooth to run with n=43 but var=33, whilst blacktip (114, 4.9) and reddrum (56, 2.2) failed, deepens my suspicion that variance is at least as important as n. I suspect I might be able to derive an equation to get a better handle on this, much like gbm.bfcheck does"
Essentially is there a 'viability space' you could map? e.g.