memory leak in useDrawCallback
related to #625
Any closure dependency of useDrawCallback lives forever. The draw callback function does appear to be garbage collected, however.
Steps to reproduce
this is the example code
export const SkiaGradientImp = ({
  width,
  height,
}: {
  width: number;
  height: number;
}) => {
  const paint = Skia.Paint();
  const onDraw = useDrawCallback((canvas) => {
    // Cyan Circle
    paint.setShader(
      Skia.Shader.MakeLinearGradient(
        Skia.Point(0, 0),
        Skia.Point(width, height),
        ["red", "cyan", "lime"].map((color) => Skia.Color(color)),
        null,
        TileMode.Clamp
      )
    );
    canvas.drawRect(Skia.XYWHRect(0, 0, width, height), paint);
  });
  return <SkiaView style={{ width, height }} onDraw={onDraw} />;
};

export const PerformanceGradients = () => {
  const [index, setIndex] = useState(0);
  return (
    <TouchableWithoutFeedback onPress={() => setIndex((i) => i + 1)}>
      <View style={{ flex: 1, flexDirection: "row", flexWrap: "wrap" }}>
        {new Array(300).fill(0).map((_, i) => (
          <SkiaGradientImp key={`${index}-${i}`} width={30} height={30} />
        ))}
      </View>
    </TouchableWithoutFeedback>
  );
};
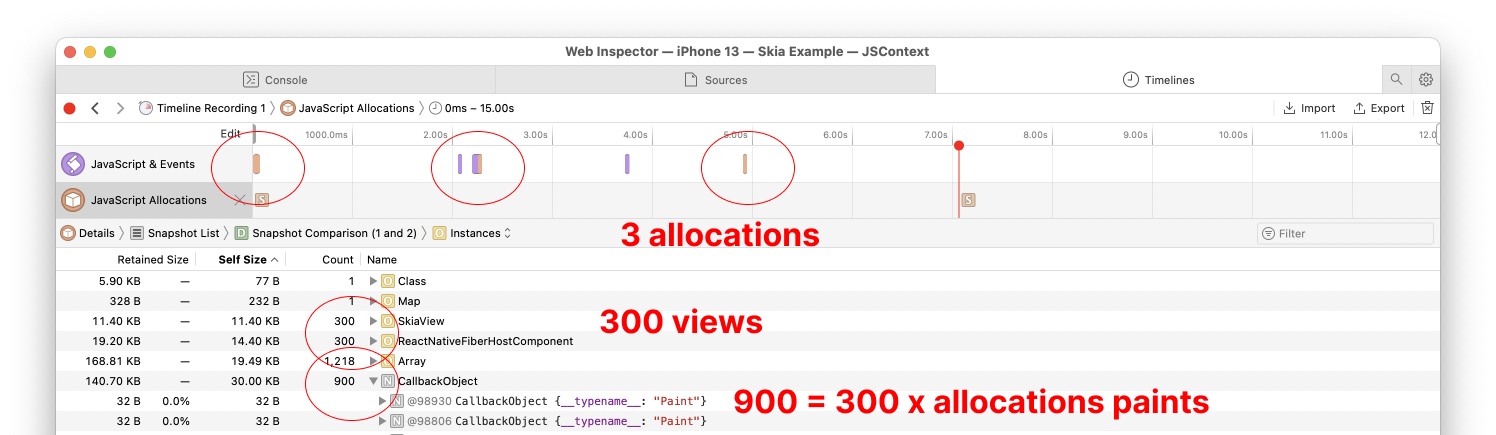
If you press the button, you will have 300 views in memory but 600 paints objects. If paint is not a closure dependency (we move it's creation in the callback), it appears to be deleted properly.
In the case of the renderer, the dependencies to the closure are enormous et therefore the memory leak is much more obvious to notice.
Part of investigating the issue, I setup a small test with callback functions: JS:
  const path = Skia.Path.Make();
  canvas.drawCB(() => {
    console.log({ path });
  });
  canvas.drawTest();
  canvas.drawCB(null);
C++:
  JSI_HOST_FUNCTION(drawCB) {
    if (arguments[0].isNull()) {
      _cb = nullptr;
      return jsi::Value::undefined();
    }
    _cb = std::make_unique<jsi::Function>(arguments[0].asObject(runtime).asFunction(runtime));
    return jsi::Value::undefined();
  }

    JSI_HOST_FUNCTION(drawTest) {
      _cb->call(runtime);
      return jsi::Value::undefined();
    }
I couldn't find a way to have the closure dependencies (path) to be garbage collected.
Another way to make it extremely obvious is to have large data associated with the closure (like a big SkImage).
Another thing i want to chip in is that, although maybe obvious, this also applies to animations. This turns out to be specifically an issue for loop animations. As a reproduction just run an animation with a loop and you can see how the memory usage slowly grows and grows.
(so it's not just useDrawCallback, but also the callback we pass to e.g. createAnimation)
That's a real blocker when trying to rely on skias animation API 🤔 (because of a fear of OOM)
I've made a few tests both for the draw callback and also for the animations. I can see the memory growing when running the animation example in our code, but for the following code I couldn't get the memory to change at all:
export const AnimationExample: React.FC = () => {
  const loop = useLoop();
  const x = useComputedValue(() => {
    console.log(loop.current);
    return loop.current * 100;
  }, [loop]);

  return (
    <View style={styles.container}>
      <Canvas style={{ flex: 1 }}>
        <Rect x={x} y={100} width={50} height={50} color="red" />
      </Canvas>
    </View>
  );
};
Could this be an issue not with GC in Javascript but with deallocations in iOS (which is also non-deterministic when using ARC)?
If I remove the Animate text on path example from the animations screen the memory seems to be stable, leading me to think there might be a leak in our text rendering code which we will investigate.
I've also tested both the animation callback for leaks in Instruments / Xcode without any trace of a leak.
Just to be sure we are on the same page, my reproduction looks like this:
// Changed version from the examples to just use a timing loop, as minimal reproduction
export const InterpolationWithEasing = () => {
  const { width } = useWindowDimensions();
  // Create timing loop
  const progress = useTiming(
    {
      from: 10,
      to: width - (Size + Padding),
      loop: true,
      yoyo: true,
    },
    {
      duration: 1000,
      easing: Easing.inOut(Easing.cubic),
    }
  );

  return (
    <AnimationDemo title={"Interpolating value using an easing"}>
      <Canvas style={styles.canvas}>
        <Fill color="white" />
        <Circle cx={progress} cy={20} r={10} color="#DC4C4C" />
      </Canvas>
    </AnimationDemo>
  );
};

const styles = StyleSheet.create({
  canvas: {
    height: 40,
    width: "100%",
    backgroundColor: "#FEFEFE",
  },
});
Using this, I can see that over time there is a small, but compounding growth of memory usage (so it's not stable for me if I remove the Animate text example, so I don't feel its related):
(Video playing at 9x speed, memory grew from
162.52to194.06)
https://user-images.githubusercontent.com/16821682/183045242-9ecd70be-8ea2-416f-937c-8765e9553da9.mp4
To verify this
"Could this be an issue not with GC in Javascript but with deallocations in iOS"
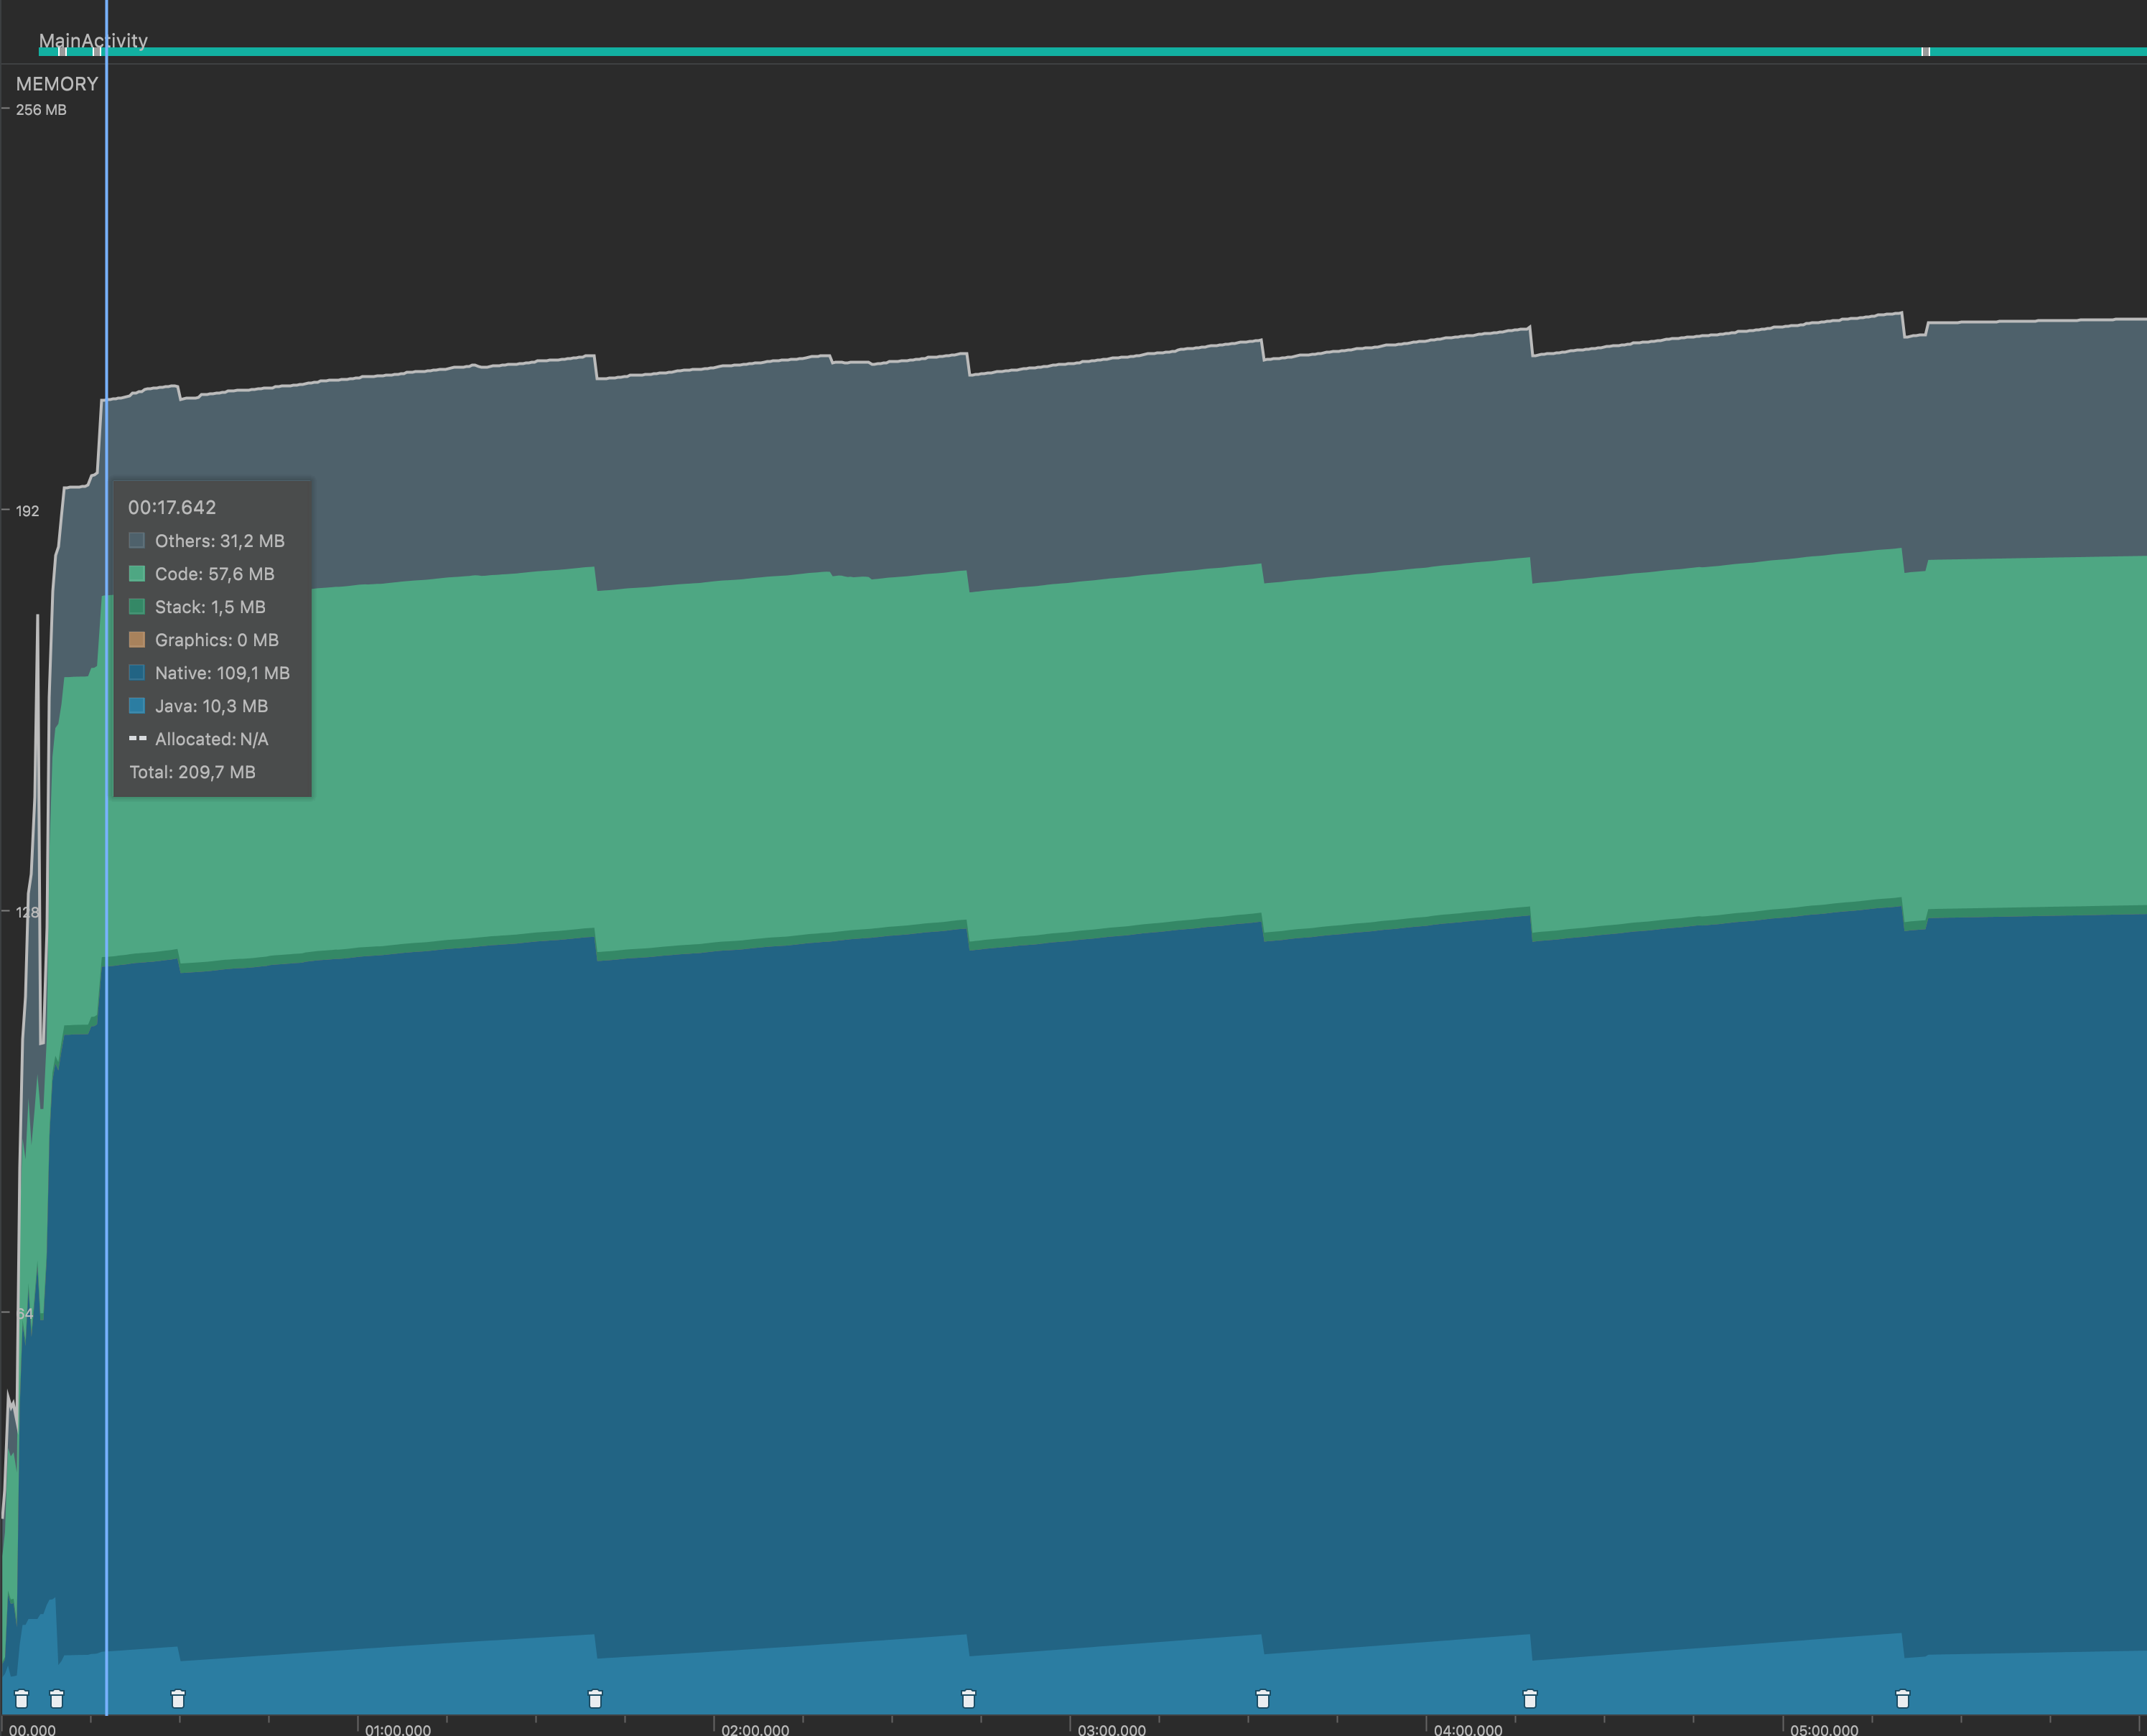
I felt that testing it on android using the Android Studio Profiler could be used to invalidate the hypothesis. If the memory grew here as well, it would not be just a issue with deallocations in iOS.
The result:
Start of reproduction
End of reproduction (leaving screen)
Staying on start screen (without repro)
I made the following observations:
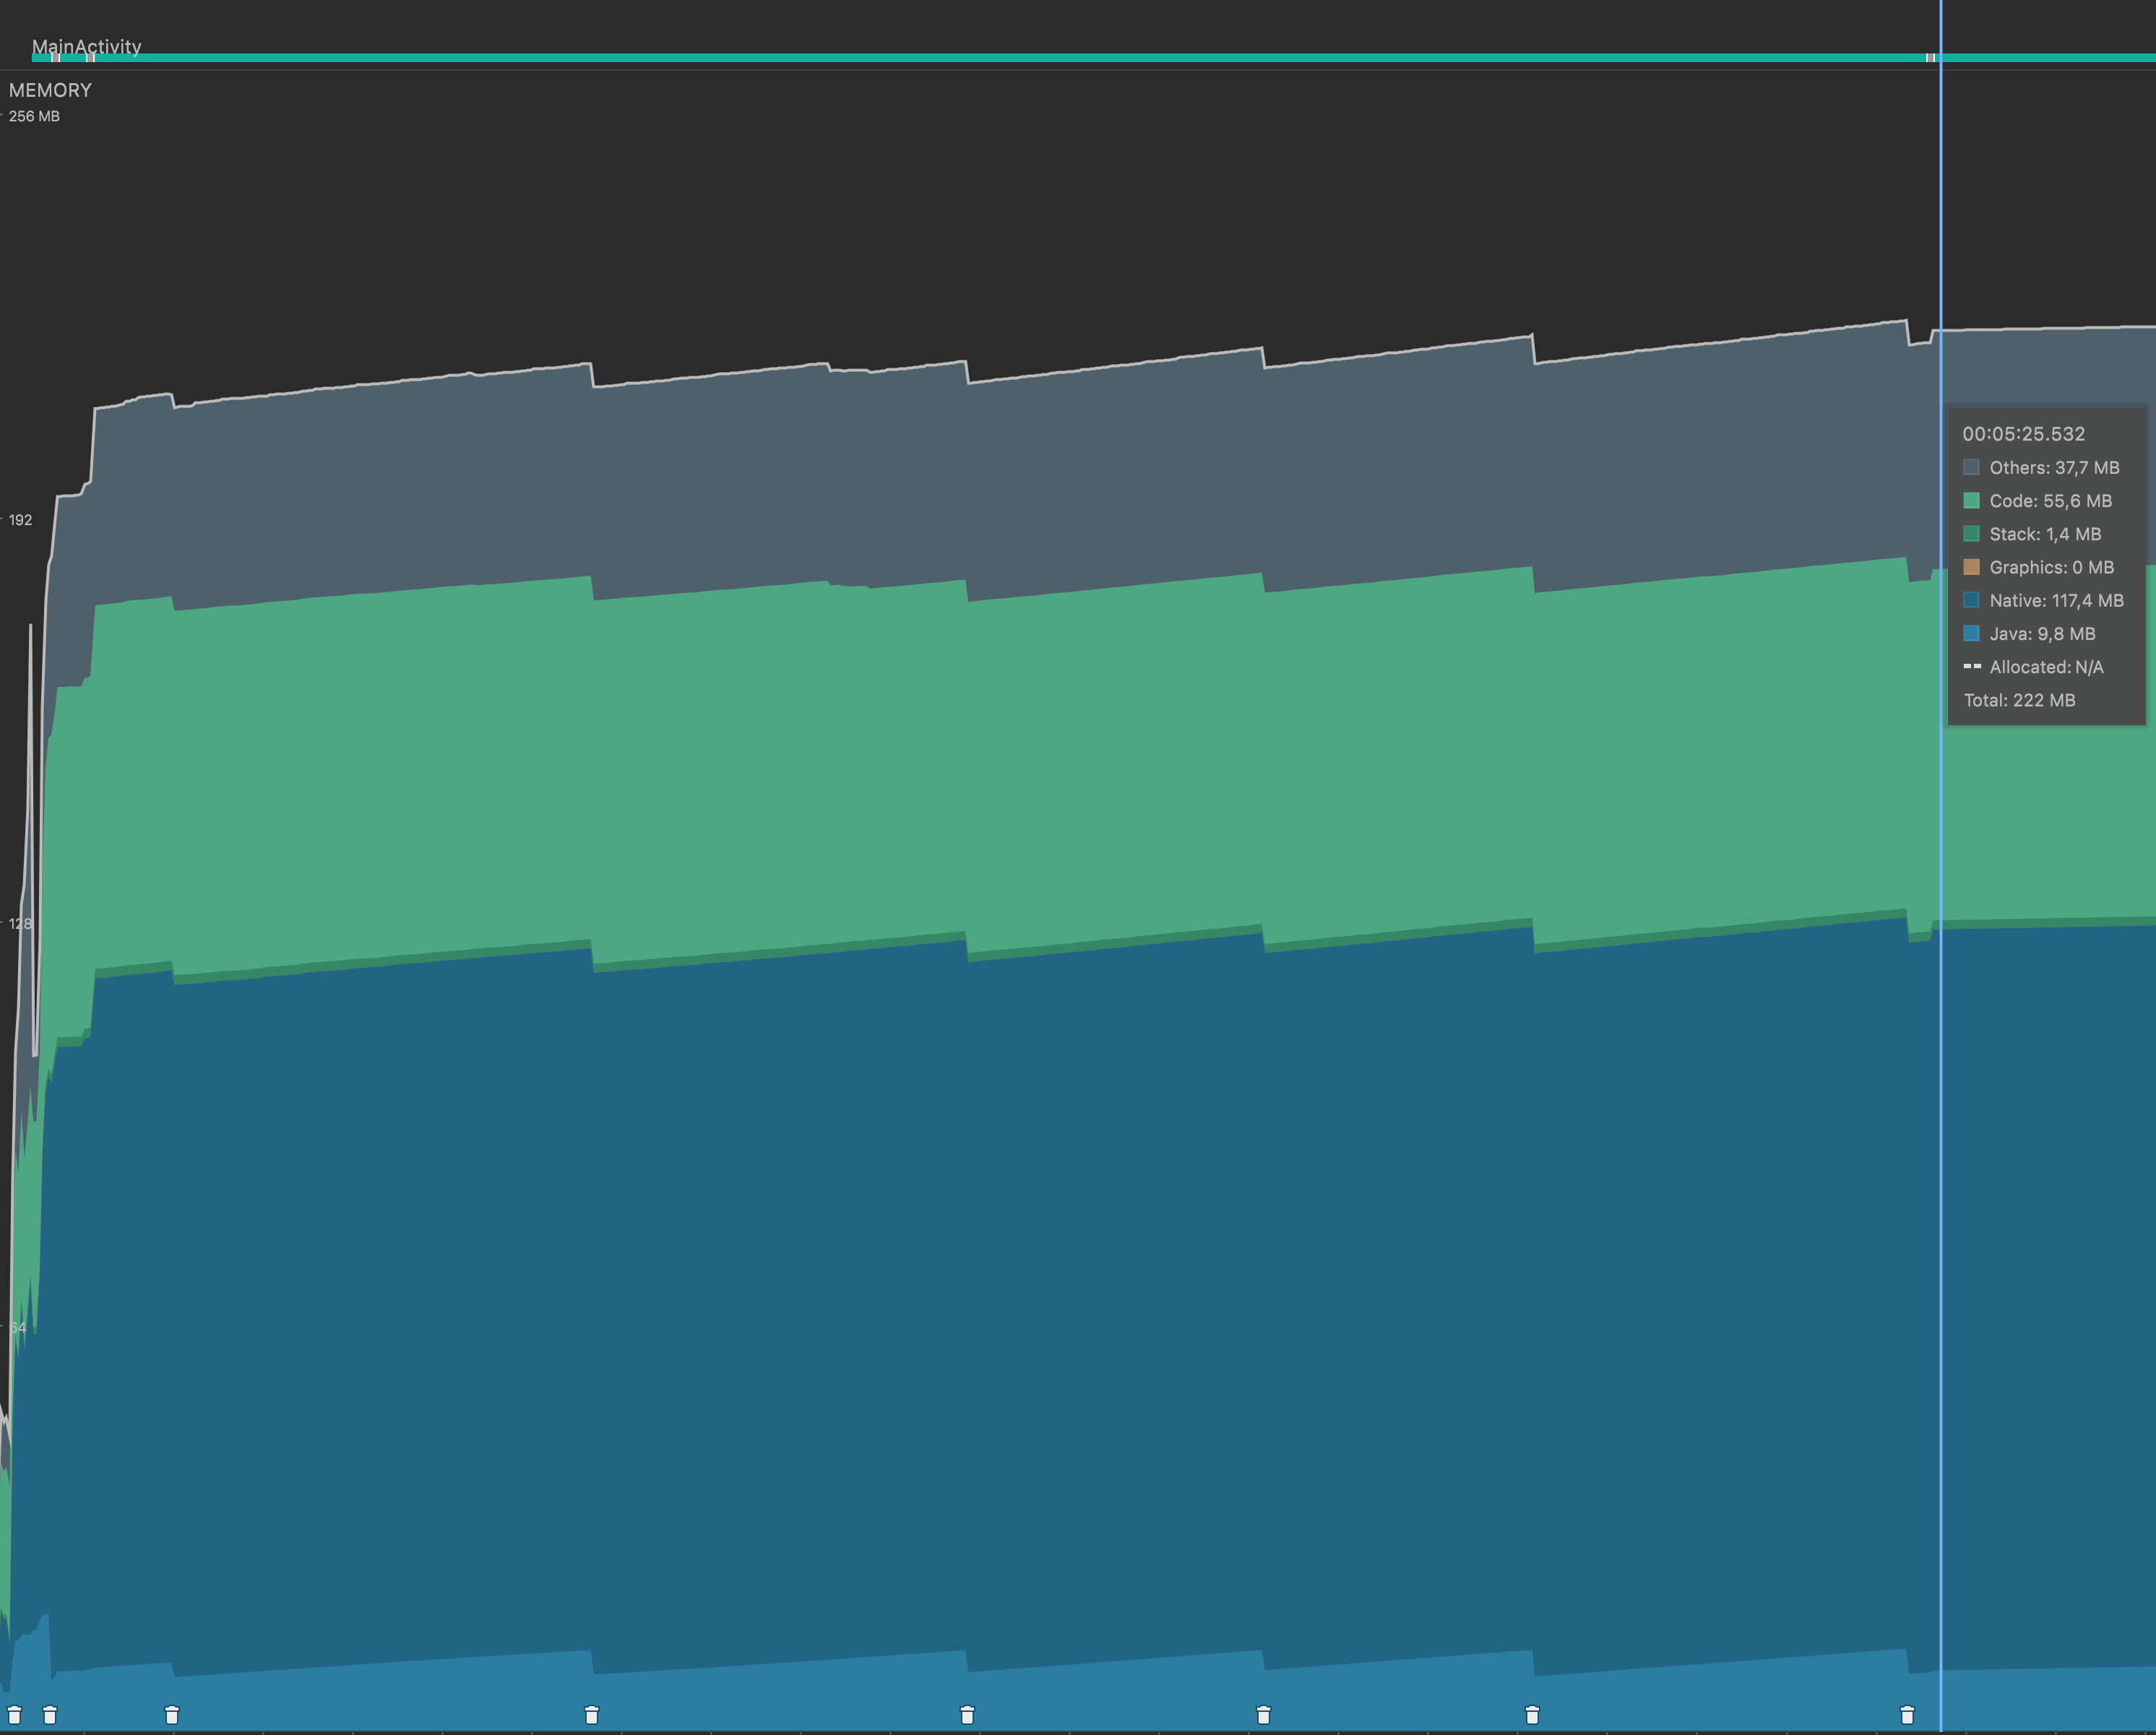
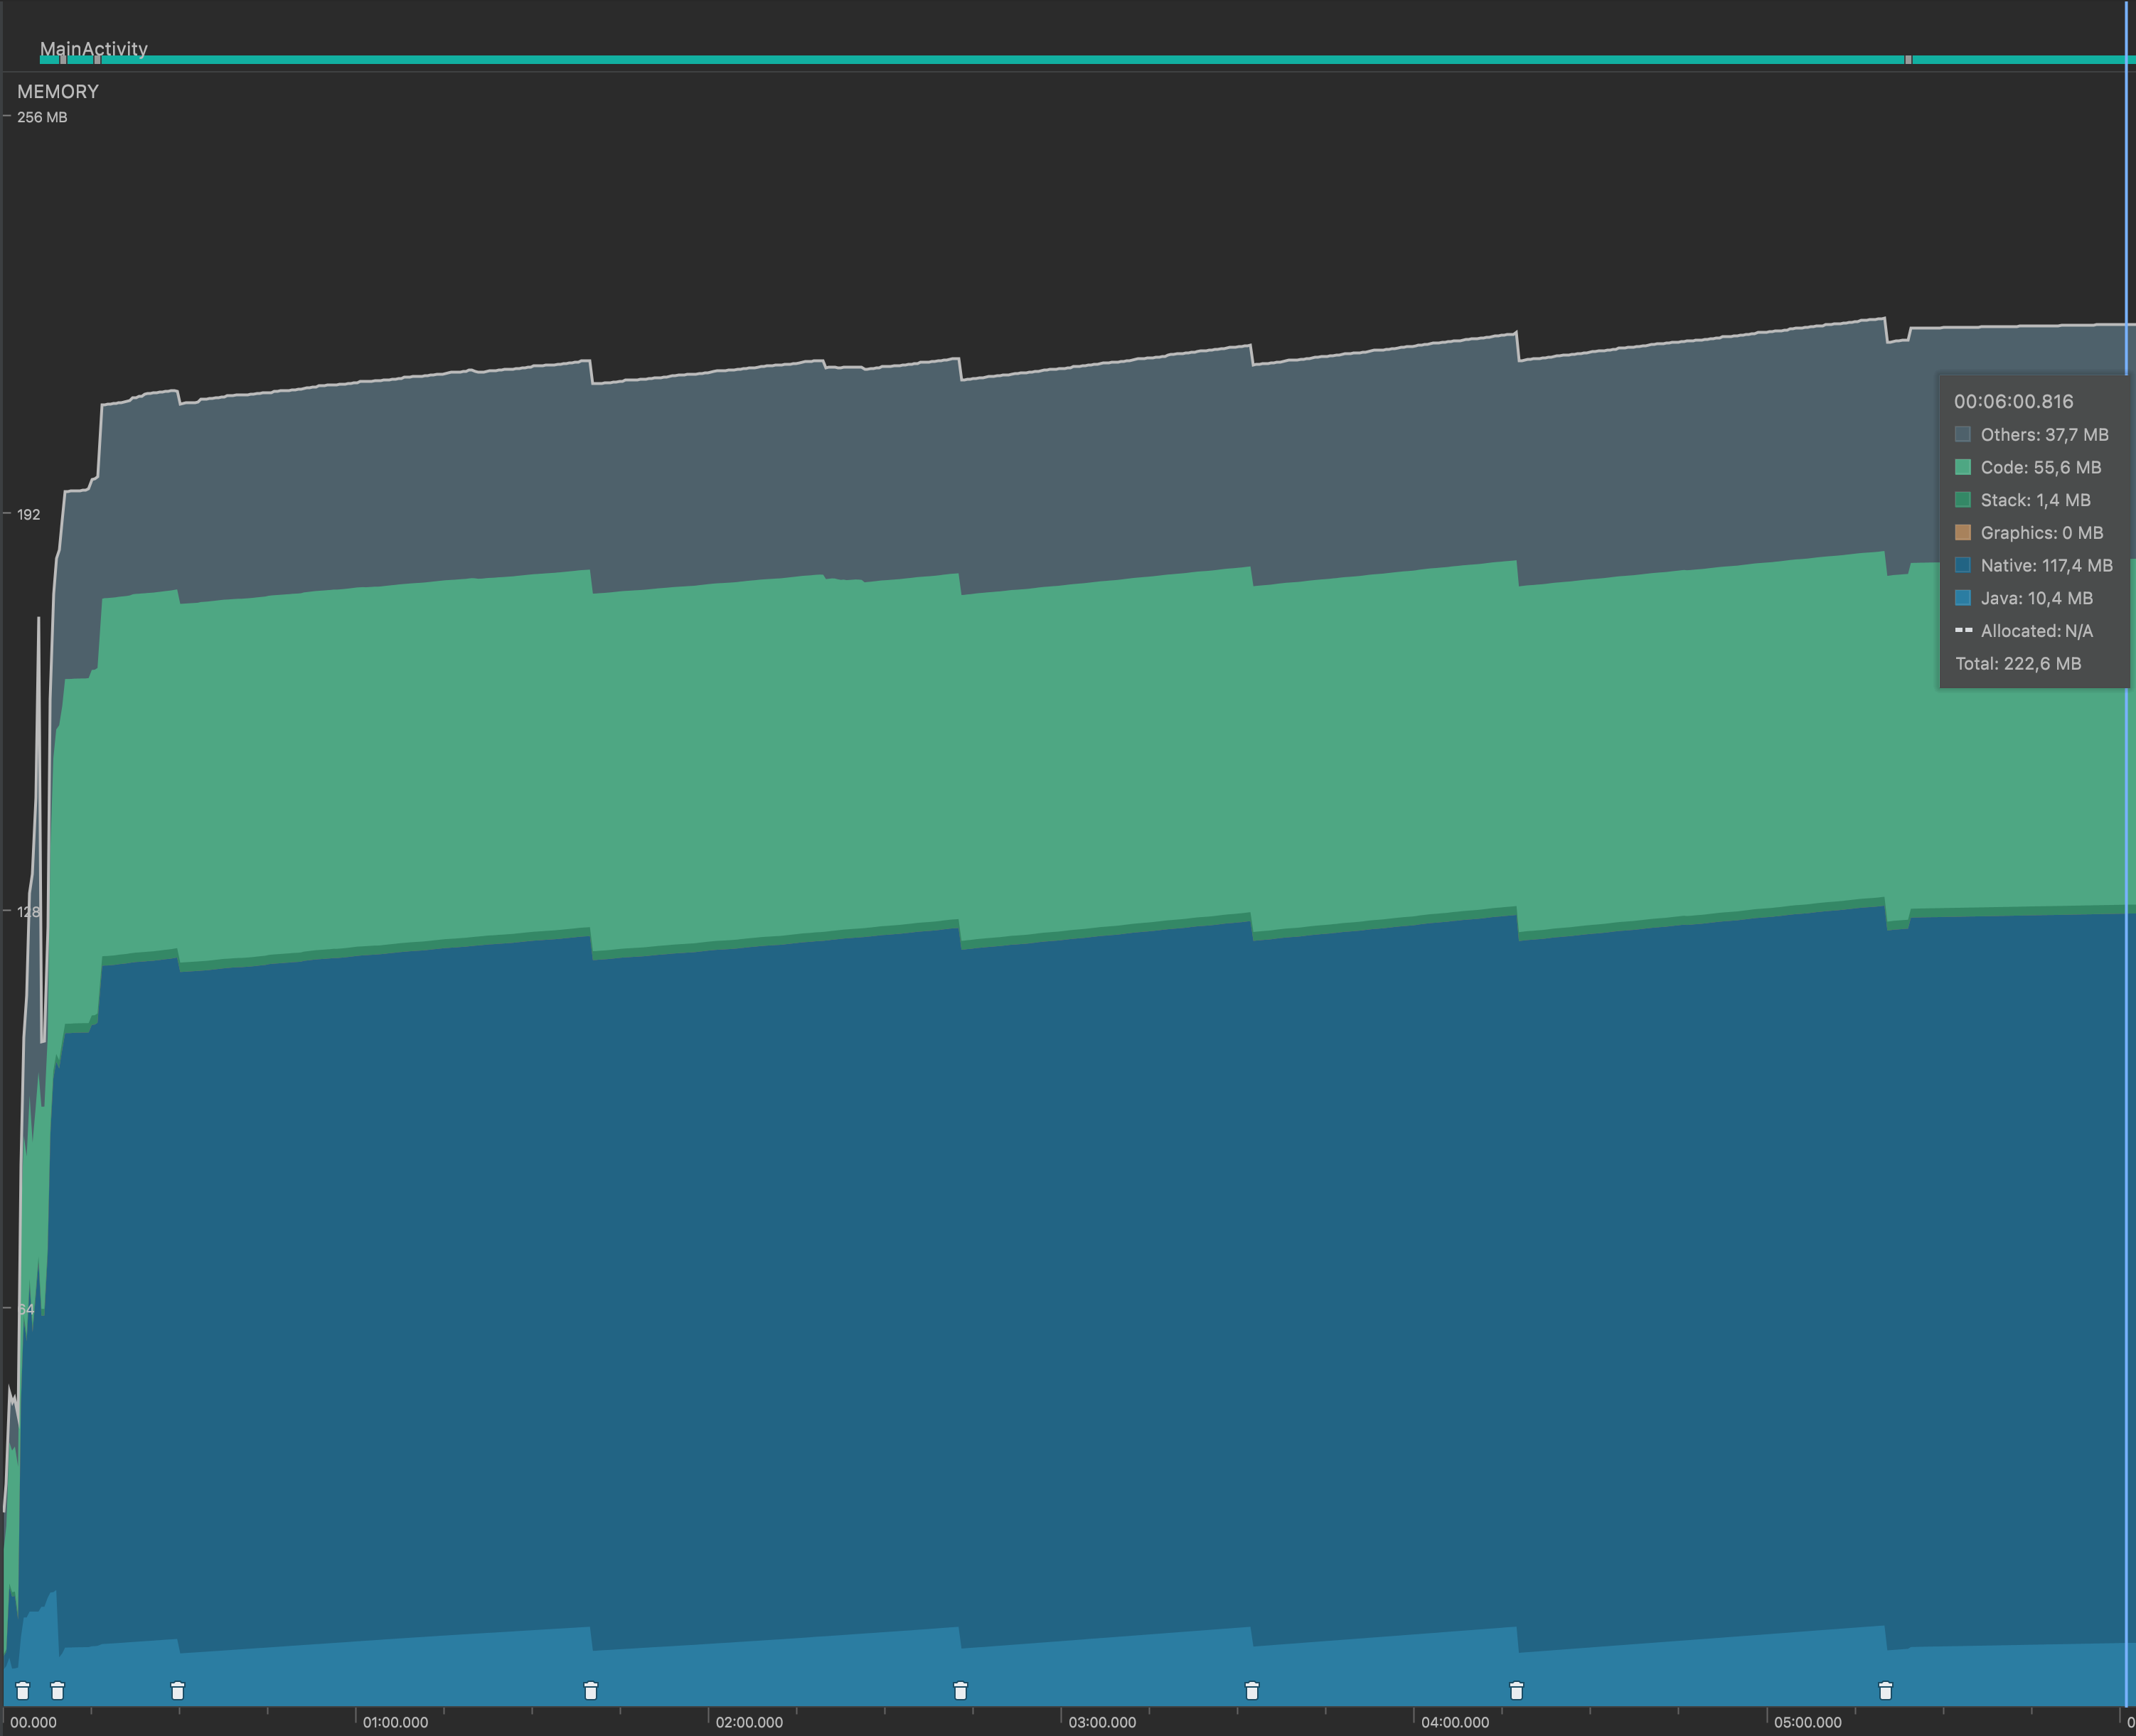
- The native memory grew from
109.1mbto117.4mbover a time span of ~6 minutes, That's an increase of8.3mb. That's way less than how the memory grew on iOS - The memory used for allocations in Java, grew quicker, more how the memory grew on iOS, however, there were GC events that cleaned that memory away
- After leaving the screen with the reproduction, the native memory didn't drop. I kept it open for ~1min and I saw no memory decrease or increase.
Not sure how to read those observations, maybe they mean something to you?
Thanks so much for the input, @hannojg!! I'll spend some time today trying to reproduce and investigate this. I also sent you a Slack invitation so that we'll be able to discuss directly if necessary.
Using your example above I’m still not able to reproduce this on my side, memory isn’t growing with the example you added. I ran the same example for 10 minutes on iOS and the memory is now even lower than when I started the example.
This makes me believe that this is about iOS ARC and memory dereferencing. I've seen similar issues like this on iOS before, and it is all about iOS not releasing memory because it "doesn't have to". When running on devices in release mode things seems to be released correctly (when measuring).
In our native Skia View implementation on iOS we are controlling this explicitly by wrapping the render logic in an @autoreleasepool block to ensure that ARC are cleaning up correctly.
Could you try your example on a device in release mode and see if you still have the same issue? I've also measured memory leaks in Instruments on iOS and there are no leaks that could explain such a big increase in memory as the one you are seeing.
Could you also try to wrap the animation tick code in an autoreleasepool? This is in the file package/ios/RNSkia-iOS/PlatformContext.mm on line 49, change to:
[_displayLink start:^(double time) {
      @autoreleasepool {
        notifyDrawLoop(false);
      }
}];
I don't see any difference here on my side so I haven't added this yet - but based on your experiences we can consider adding it. It is still a bit "wrong" to add this fix since it might not be a problem other than we you debug and develop on the Simulator.
On Android we have a similar issue with Java allocations as you also saw where it is a bit hard to find out where memory is allocated.
(Just a small note, running on device (iOS) does not show any signs of memory leaks either.)