cartopy
 cartopy copied to clipboard
fill function paint outside and not inside the polygon
I have a odd behaviour since it is the ouside of the polygon that is filled.
fig = plt.figure()

x, y = [-44, -44, 45, 45, -44], [-45, 80, 80, -45, -45]

ax = fig.add_subplot(1, 1, 1, projection=ccrs.Robinson(10))
ax.coastlines()
ax.plot(x, y, marker='o', transform=ccrs.Geodetic())
ax.fill(x, y, color='coral', transform=ccrs.Geodetic(), alpha=0.8)
ax.gridlines()
ax.set_global()

plt.show()
Am I missing something ?
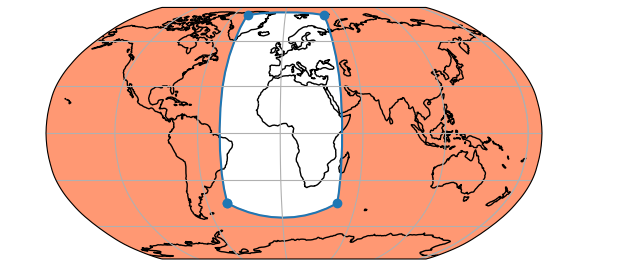
tested with cartopy 0.21.0
If you reverse the order of the coordinates, that should fill the internal side. You might also want to create a patch instead which I don't think would have that issue?
I have made several tests and I suspect that there is bug somewhere. But I may have missed something. I would like to get some explanations...
Test1
fig = plt.figure()
x, y = [-60, -60, 60, 60, -60], [-60, 60, 60, -60, -60]
ax = fig.add_subplot(1, 1, 1, projection=ccrs.Robinson(10))
ax.coastlines()
transform = ccrs.PlateCarree()
ax.plot(x, y, marker='o', transform=transform)
ax.fill(x, y, color='coral', transform=transform, alpha=0.8)
ax.gridlines()
ax.set_global()
plt.show()

Test2
fig = plt.figure()
x, y = [-60, -60, 60, 60, -60], [-60, 60, 60, -60, -60]
ax = fig.add_subplot(1, 1, 1, projection=ccrs.Robinson(10))
ax.coastlines()
transform = ccrs.Geodetic()
ax.plot(x, y, marker='o', transform=transform)
ax.fill(x, y, color='coral', transform=transform, alpha=0.8)
ax.gridlines()
ax.set_global()
plt.show()
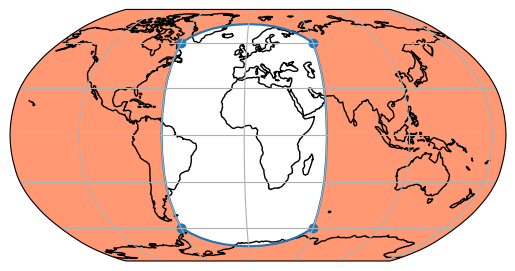
So why there is a difference of filling just because I have changed the transform projection, first ccrs.PlateCarree() and second ccrs.Geodetic() ?
Use of matplotlib.patches.Polygon does not change anything.
fig = plt.figure()
x, y = [-60, -60, 60, 60, -60], [-60, 60, 60, -60, -60]
ax = fig.add_subplot(1, 1, 1, projection=ccrs.Robinson(10))
ax.coastlines()
transform = ccrs.Geodetic()
ax.plot(x, y, marker='o', transform=transform)
patch = matplotlib.patches.Polygon(list(zip(x, y)), closed=True,
                               facecolor='coral', transform=transform)
ax.add_patch(patch)
ax.gridlines()
ax.set_global()
plt.show()
And to give the context, I have extracted paleo continents from a ESM at paleotimes and I would like to produce maps with filled paleo continents. If I do not use ccrs.Geodetic() then I get overlaps.
import matplotlib.pyplot as plt
import cartopy.crs as ccrs
import xarray as xr
! wget -q -nc https://thredds-su.ipsl.fr/thredds/fileServer/ipsl_thredds/brocksce/cartopy/paleo_continents.nc
ds = xr.open_dataset("paleo_continents.nc")
x = ds['CONT_LON'] ; y = ds['CONT_LAT']
fig = plt.figure(figsize=(10,5))
ax = fig.add_subplot(1, 1, 1, projection=ccrs.Robinson(100))
transform = ccrs.PlateCarree()
#transform = ccrs.Geodetic()
ax.plot(x, y, transform=transform, color='red', lw=0.5)
#ax.fill(x, y, transform=transform, color='red', lw=0.5, edgecolor="black")
ax.set_global()
plt.show()
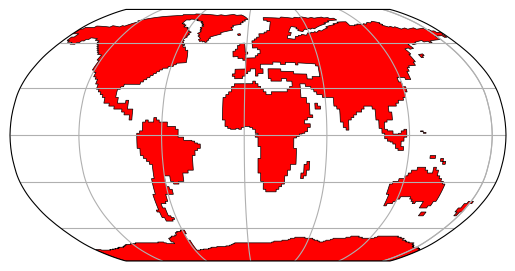
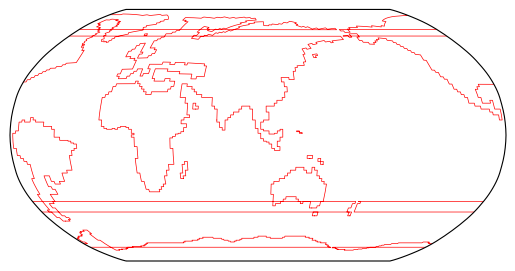 Compare to
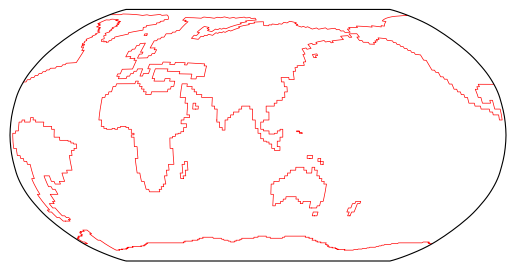 with a
 transform = ccrs.Geodetic()
Now back to my underline question, how to draw a map with filled continents ? Uncomment ax.fill() will produce filed oceans with ccrs.Geodetic() and overlaps with ccrs.PlateCarree().
A test with a order reversed of the different polygons works nicely . Good.
Perhaps that I have missed this specification in the documentation that clockwise positons gives a filled outside and an anticlockwise gives a filled inside. But that is not explaining why this difference exists only with a ccrs.Geodetic() transform !
Use of shapely.geometry.polygon.orient(polygon) will reorient correctly the polygon. Read https://shapely.readthedocs.io/en/stable/manual.html#shapely.geometry.polygon.orient