pcolorfast does not show data
Description
pcolorfast does not show an image, all just remains blank
Code to reproduce
from matplotlib.cm import get_cmap
from numpy import mgrid
import numpy as np
import matplotlib.pyplot as plt
import cartopy.crs as ccrs


pi = np.pi
r2d = 180/pi


def x():
    n = 2**10

    cmap = get_cmap('bwr_r')
    theta, phi = mgrid[0:pi:(n+1)*1j, 0:2*pi:(n*2+1)*1j]

    lon = r2d * phi
    lat = 90 - r2d * theta

    tc = 0.25 * (theta[1:,1:] + theta[:-1,1:] + theta[:-1,:-1] + theta[1:,:-1] )
    pc = 0.25 * (  phi[1:,1:] +   phi[:-1,1:] +   phi[:-1,:-1] +   phi[1:,:-1] )

    v = (np.sin(3*tc)*np.cos(4*pc))**2

    col = cmap(v)

    fig = plt.figure()
    pj = ccrs.Orthographic(central_longitude=0, central_latitude=0)
    ax = fig.add_subplot(111, projection=pj, position=[0,0,1,1])
    ax.set_global()
    trans = ccrs.PlateCarree()

    ax.pcolorfast(lon, lat, col, transform=trans)

    # ax.pcolormesh(lon, lat, v, transform=trans, cmap=cmap)
the commented-out line works. However, I need to modify values (so can't use colormap) and the grid may not be equidistant, so pcolor image is not good to use.
Note that n > 1024 the interactive ipython session hangs up after showing the image with pcolormesh.
Traceback
image attached
Full environment definition
Operating system
Frdoar 35
Cartopy version
0.20.1
conda list
N/A
pip list
Requirement already satisfied: Cartopy in ./Python_3.10.1/lib/python3.10/site-packages (0.20.1)
all packages are current with pypi as of time of this post.
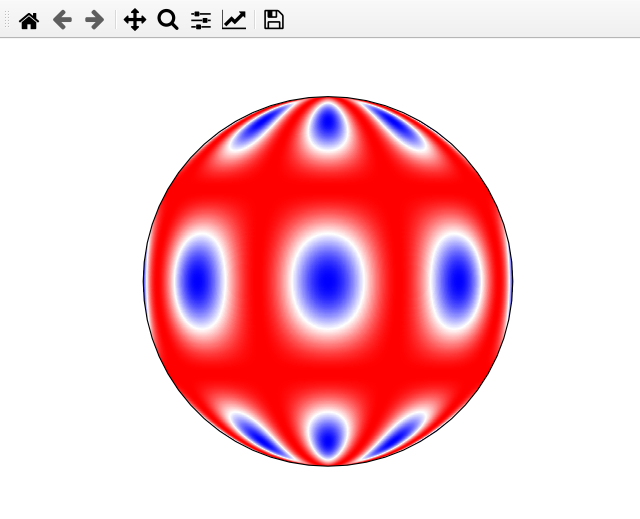
This is how the image should look like:
It looks like pcolorfast is not implemented in Cartopy. At least, I can’t find it by searching geoaxes.py.
How then to display RGB values on non-uniform grid (all colours, not using a colormap)?
I think the behaviour should be not too different from pcolormesh - creating a QuadMesh artist, except it can use color map or accept direct color (RGB values).