Central_latitude dont work with negative values
Hello,
Whenever I attempt to generate an Orthographic projection with my data for latitudes below +8.84, I get only a blank square and the colorbar.
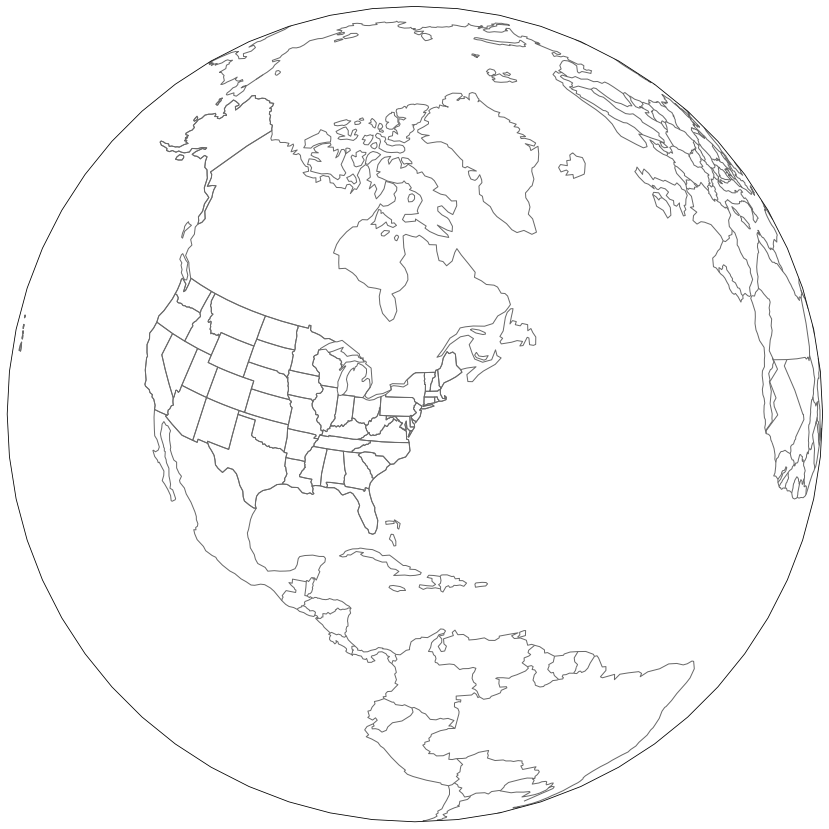
ax = plt.axes(projection=ccrs.Orthographic(central_longitude=0, central_latitude=-90))
For the PlateCarrée projection and for the Orthographic projection with latitudes >= +8.84, it works just fine, though.
ax = plt.axes(projection=ccrs.Orthographic(central_longitude=0, central_latitude=8.84))
Does anyone know how to make it work for lower and negative latitudes?
I can't reproduce this. This works for me:
import matplotlib.pyplot as plt
import cartopy.crs as ccrs

ax = plt.axes(projection=ccrs.Orthographic(central_longitude=0, central_latitude=-90))
ax.coastlines()

plt.show()
My guess is it has to do with your data specifically covering the entire plotting region. Can you create a minimal reproducible example and include it here?
I'm having a somewhat similar issue with just a solid-color square appearing when trying to plot in a non-PlateCarree projection.
For me, setting the projection with a negative longitude works fine for the basemap:
fig, ax = plt.subplots(1, 1, figsize=(15, 15), subplot_kw={'projection': ccrs.NearsidePerspective(central_longitude=-75,central_latitude=40),'transform':ccrs.PlateCarree()})
ax.add_feature(cfeature.BORDERS,edgecolor='dimgray')
ax.add_feature(cfeature.COASTLINE,edgecolor='dimgray')
ax.add_feature(cfeature.STATES,edgecolor='dimgray')
but when I go to add my data, I get a blank square:
fig, ax = plt.subplots(1, 1, figsize=(15, 15), subplot_kw={'projection': ccrs.NearsidePerspective(central_longitude=-75,central_latitude=40),'transform':ccrs.PlateCarree()})
ax.add_feature(cfeature.BORDERS,edgecolor='dimgray')
ax.add_feature(cfeature.COASTLINE,edgecolor='dimgray')
ax.add_feature(cfeature.STATES,edgecolor='dimgray')

ax.contourf(t8.longitude,t8.latitude,t8,transform=ccrs.PlateCarree())

My data are global temperatures defined with lat and lon coordinates:
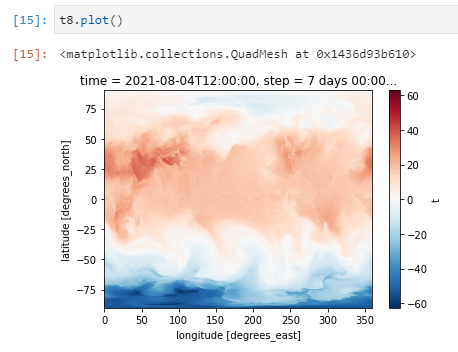
There should be data for all points covered here. Unless the pole is causing a problem and there's some trick to working around that? There is data for lat=90.0.
If you want to reproduce using the exact dataset, this netcdf contains the data I used https://storage.googleapis.com/nwp-plots/cartopy_projection_issue_data.nc
I cannot reproduce the example from https://github.com/SciTools/cartopy/issues/1822#issuecomment-894352025 with Cartopy 0.22, so I guess something happened that fixed it.