NaN values not being plotted correctly with Lambert Azimuthal Equal Area projection
Description
I have a data grid with many NaN values. I am attempting to plot this grid onto a map that has a LambertAzimuthalEqualArea projection as a contour/colorfill plot. I'm using matplotlib.pyplot's colormap and utilizing the colormap.set_bad() function to set all NaN values to white. This works great for other projections, such as PlateCarree, Sinusoidal, and NorthPolarStereo. LambertAzimuthalEqualArea is the only projection that does not honor the colormap's "bad" value (white), instead using a seemingly random value from the colormap's segment data.
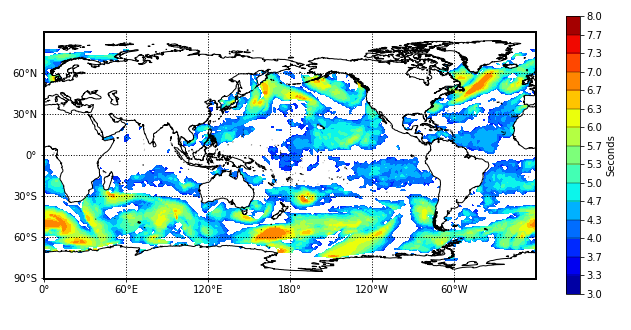
An example of the PlateCarree projection working as intended, with all NaN values plotting as white:
An example of the LambertAzimuthalEqualArea projection bug:

Code to reproduce
import cartopy.crs as ccrs
import matplotlib.pyplot as pyplot
import numpy as np
import xarray as xr

cmap = pyplot.get_cmap('jet')
cmap.set_bad('white')
interval = np.linspace(3.0, 8.0, 15)

m = pyplot.axes(projection=ccrs.LambertAzimuthalEqualArea(central_longitude=180, central_latitude=0))

da = xr.open_dataset('wind')
x = getattr(da, 'lon', 'longitude').data
y = getattr(da, 'lat', 'latitude').data
mag_grid = da.isel(time=0)['waves']

plot = m.contourf(x, y, mag_grid, levels=interval, cmap=cmap, extend='neither', alpha=1.0, transform=ccrs.PlateCarree())
Traceback
N/A
Full environment definition
Operating system
CentOS Linux 7 (Docker)
Cartopy version
Cartopy 0.19.0.post1
conda list
matplotlib==3.3.4
numpy==1.18.1
xarray==0.14.0
Sorry you never got a response on this @jessefkolb! In order to investigate, we would need access to the data to be able to reproduce your example. Is this still an issue for you?