cartopy
 cartopy copied to clipboard
Handling ticks, ticklabels, labels, gridlines and curvilinear boundaries using mpl_toolkits.axisartist?
Description
There seem two existing approaches to implement curvilinear projections using matplotlib, projection and axisartist. The current implementation of cartopy follows the projection approach, which shows a nice consistency with the general matplotlib workflows. However, handling ticks, ticklabels, gridlines with flexibility seem still a challenge. Although gridliner provides increasingly more features, plotting tick markers and using customed curvilinear boundaries are still difficult. The single issue has constantly driven me back to GMT to making the final version of figures for publications.
After waiting for almost two years, I decided to implement the feature myself. The challenge is that using axisartist seems a completely different way from using projection, so I ended up with an alternative GeoAxes class that initialize using the InterProjectionTransform, and floating axes in axisartist. Good thing is, it can handle ticks and everything in a generic way (hopefully). But it lost all the plotting functions in GeoAxes. I just managed to add a function to add Features (e.g. NaturalEarthFeature).
I wonder if there is a way to incorporate it into GeoAxes, or to exist as an alternative in cartopy.
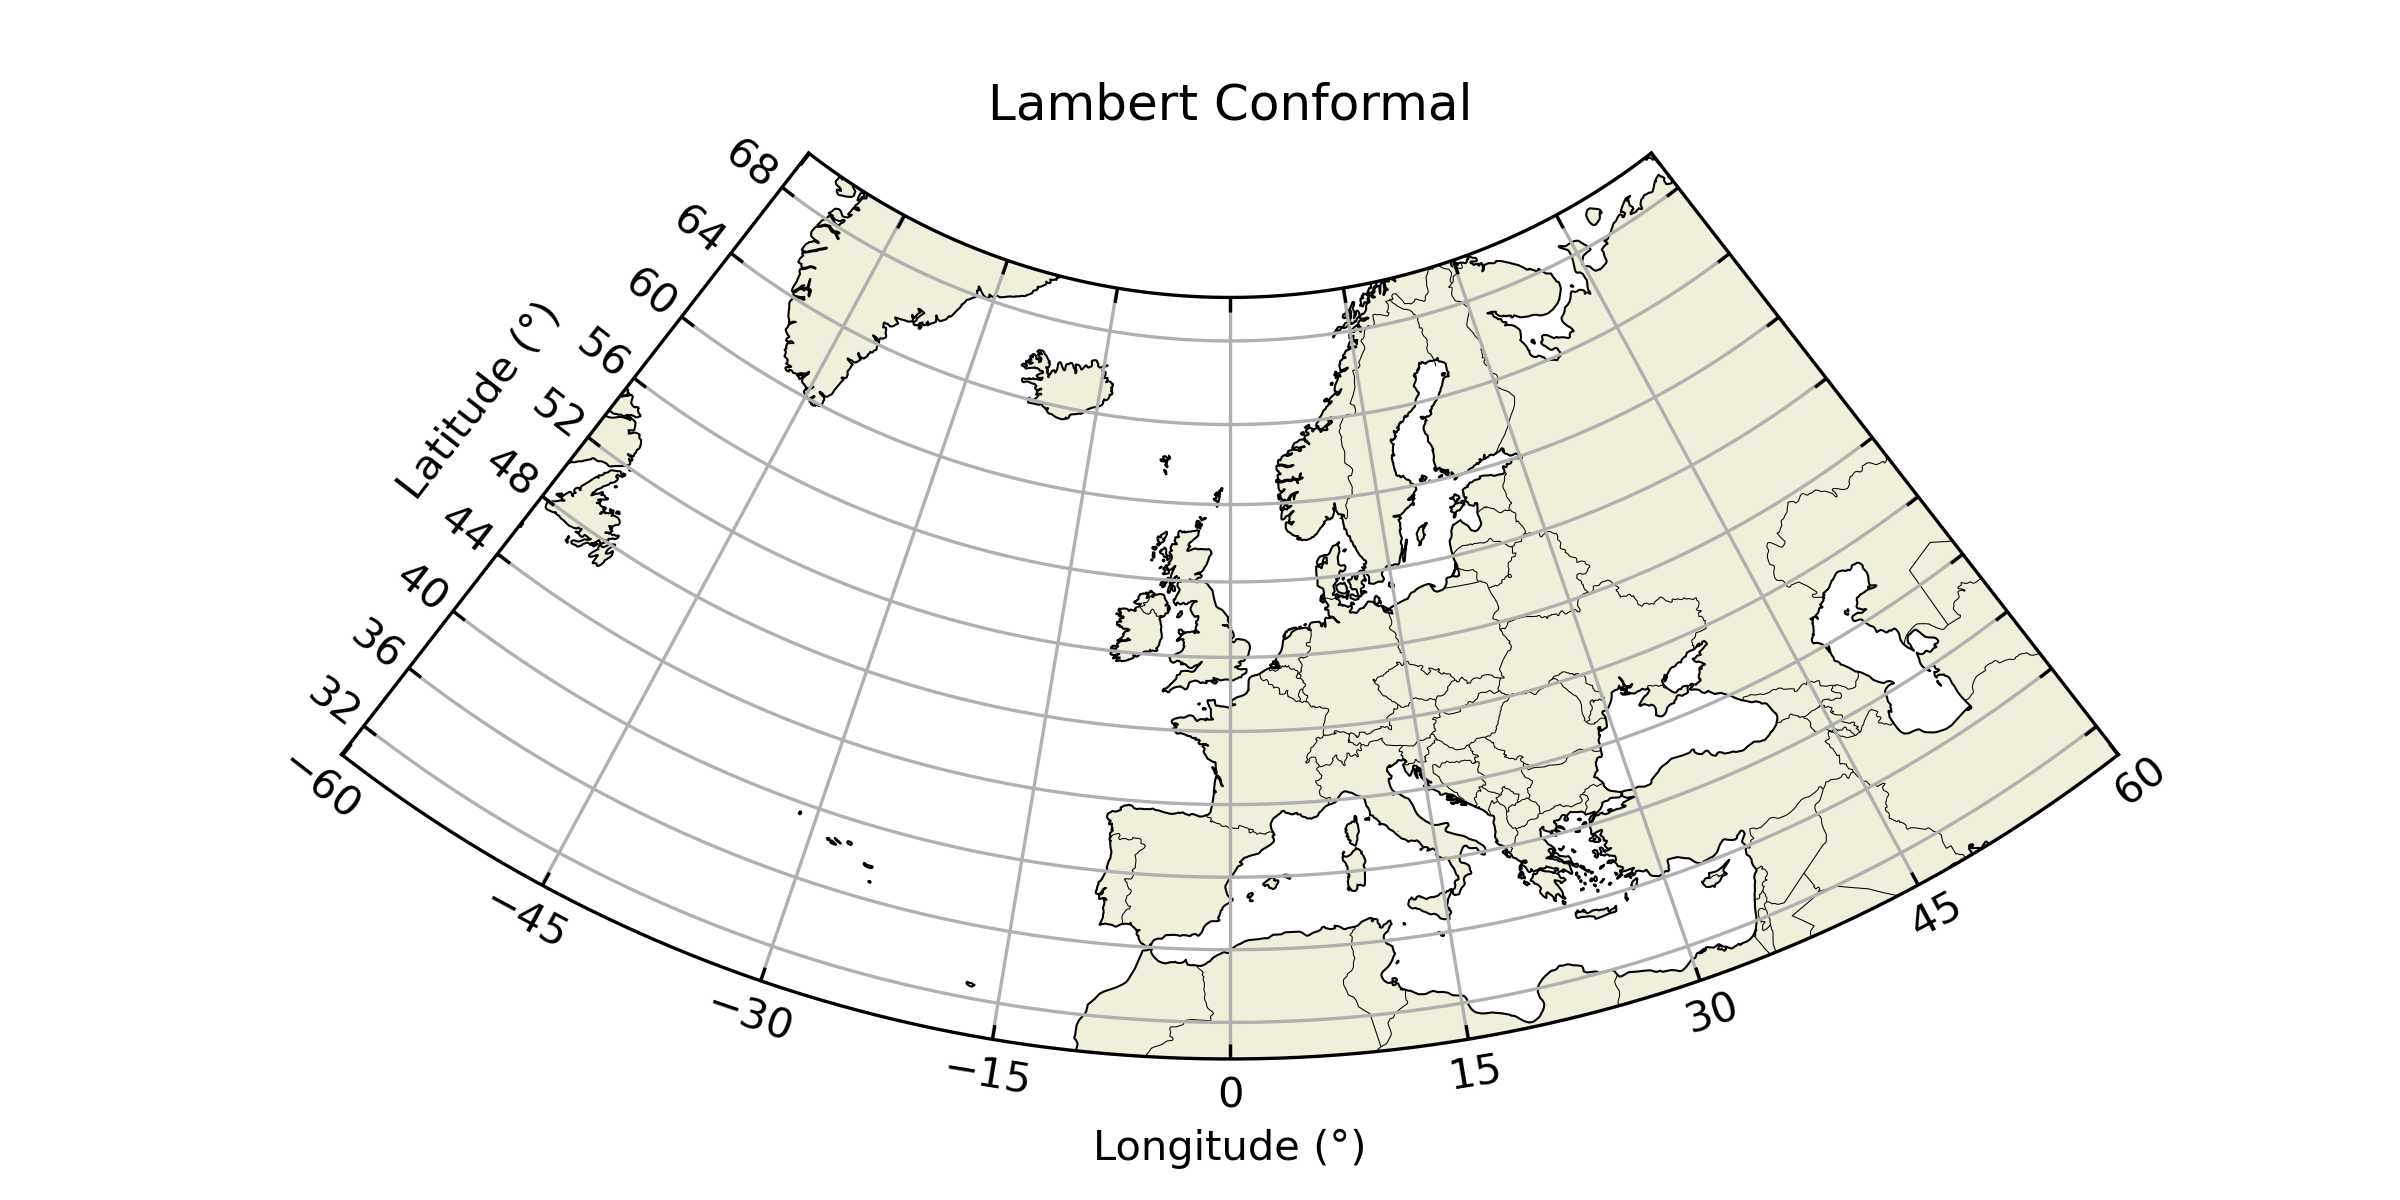
Here is an example.
from collections import OrderedDict
import warnings
import weakref

import numpy as np
import matplotlib
import matplotlib.pyplot as plt
import matplotlib.artist
import matplotlib.collections
import mpl_toolkits.axisartist.floating_axes as floating_axes
from mpl_toolkits.axisartist.floating_axes import FloatingSubplot

import cartopy.crs as ccrs
import cartopy.mpl.patch as cpatch
from cartopy.mpl.feature_artist import FeatureArtist, _freeze, _GeomKey
from cartopy.mpl.geoaxes import InterProjectionTransform

class AnAlternativeGeoAxes:
    def __init__(self, fig, rect, proj, region):
        """use ax_lonlat for (lon, lat) data
        use ax_proj for (x, y) data"""
        tr = InterProjectionTransform(ccrs.PlateCarree(),
                                             proj)
        grid_helper = floating_axes.GridHelperCurveLinear(
            tr,
            extremes=region,
            grid_locator1=None,
            grid_locator2=None,
            tick_formatter1=None,
            tick_formatter2=None)
        self.ax_proj = myFloatingSubplot(fig, proj, tr, rect, grid_helper=grid_helper)
        fig.add_subplot(self.ax_proj)

        self.ax_lonlat = self.ax_proj.get_aux_axes(tr)
        self.ax_lonlat.patch = self.ax_proj.patch  # for aux_ax to have a clip path as in ax
        self.ax_proj.patch.zorder = 0.9  # but this has a side effect that the patch is
        # drawn twice, and possibly over some other
        # artists. So, we decrease the zorder a bit to
        # prevent this.
        self.tr = tr
        self.target_crs = proj

    def scatter(self, *args, **kwargs):
        self.ax_lonlat.scatter(*args, **kwargs)

    def grid(self, *args, **kwargs):
        self.ax_proj.grid(*args, **kwargs)

    def set_xlabel(self, *args, **kwargs):
        self.ax_proj.set_xlabel(*args, **kwargs)

    def set_ylabel(self, *args, **kwargs):
        self.ax_proj.set_ylabel(*args, **kwargs)

    def set_title(self, *args, **kwargs):
        self.ax_proj.set_title(*args, **kwargs)

    def add_cartopy_feature(self, feature, zorder=1, **kwargs):
        artist = myFeatureArtist(feature, zorder=zorder, **kwargs)
        self.ax_proj.add_artist(artist)

class myFloatingSubplot(FloatingSubplot):
    def __init__(self, fig, proj, tr, *args, **kwargs):
        super().__init__(fig, *args, **kwargs)
        self.projection = proj
        self.tr = tr

    # I added 'get_extent' here to be called by myFeatureArtist
    def get_extent(self):
        xlim = self.get_xlim()
        ylim = self.get_ylim()
        extent = (xlim[0], xlim[1], ylim[0], ylim[1])
        return extent

class myFeatureArtist(FeatureArtist):
    def __init__(self, feature, **kwargs):
        super().__init__(feature, **kwargs)

    def draw(self, renderer, *args, **kwargs):
        """
        Draw the geometries of the feature that intersect with the extent of
        the :class:`cartopy.mpl.GeoAxes` instance to which this
        object has been added.

        """
        if not self.get_visible():
            return

        ax = self.axes
        feature_crs = self._feature.crs

        # Get geometries that we need to draw.
        extent = None
        try:
            extent = ax.get_extent(feature_crs)
        except ValueError:
            warnings.warn('Unable to determine extent. Defaulting to global.')
        except: # added this new get_extent() here
            extent = ax.get_extent()
        geoms = self._feature.intersecting_geometries(extent)

        # Combine all the keyword args in priority order.
        prepared_kwargs = dict(self._feature.kwargs)
        prepared_kwargs.update(self._kwargs)
        prepared_kwargs.update(kwargs)

        # Freeze the kwargs so that we can use them as a dict key. We will
        # need to unfreeze this with dict(frozen) before passing to mpl.
        prepared_kwargs = _freeze(prepared_kwargs)

        # Project (if necessary) and convert geometries to matplotlib paths.
        stylised_paths = OrderedDict()
        key = ax.projection
        # key = ccrs.LambertConformal(central_longitude=0)
        for geom in geoms:
            # As Shapely geometries cannot be relied upon to be
            # hashable, we have to use a WeakValueDictionary to manage
            # their weak references. The key can then be a simple,
            # "disposable", hashable geom-key object that just uses the
            # id() of a geometry to determine equality and hash value.
            # The only persistent, strong reference to the geom-key is
            # in the WeakValueDictionary, so when the geometry is
            # garbage collected so is the geom-key.
            # The geom-key is also used to access the WeakKeyDictionary
            # cache of transformed geometries. So when the geom-key is
            # garbage collected so are the transformed geometries.
            geom_key = _GeomKey(geom)
            FeatureArtist._geom_key_to_geometry_cache.setdefault(
                geom_key, geom)
            mapping = FeatureArtist._geom_key_to_path_cache.setdefault(
                geom_key, {})
            geom_paths = mapping.get(key)
            if geom_paths is None:
                if ax.projection != feature_crs:
                    projected_geom = ax.projection.project_geometry(
                        geom, feature_crs)
                else:
                    projected_geom = geom
                geom_paths = cpatch.geos_to_path(projected_geom)
                mapping[key] = geom_paths

            if not self._styler:
                style = prepared_kwargs
            else:
                # Unfreeze, then add the computed style, and then re-freeze.
                style = dict(prepared_kwargs)
                style.update(self._styler(geom))
                style = _freeze(style)

            stylised_paths.setdefault(style, []).extend(geom_paths)

        # transform = ax.projection._as_mpl_transform(ax)
        # transData here is a transform from projected coordinates to
        # image coordinates (?).
        transform = ax.transData

        # Draw one PathCollection per style. We could instead pass an array
        # of style items through to a single PathCollection, but that
        # complexity does not yet justify the effort.
        for style, paths in stylised_paths.items():
            # Build path collection and draw it.
            c = matplotlib.collections.PathCollection(
                    paths,
                    transform=transform,
                    **dict(style))
            c.set_clip_path(ax.patch)
            c.set_figure(ax.figure)
            c.draw(renderer)

        # n.b. matplotlib.collection.Collection.draw returns None
        return None


if __name__ == '__main__':
    import cartopy.feature as cfeature
    land_50m = cfeature.NaturalEarthFeature('physical', 'land', '50m',
                                            edgecolor='k', linewidths=0.5,
                                            facecolor=cfeature.COLORS['land'])
    countries = cfeature.NaturalEarthFeature('cultural', 'admin_0_boundary_lines_land',
        '50m', edgecolor='k', linewidths=0.25, facecolor='none')


    fig = plt.figure(figsize=(8, 4), dpi=150)
    ax = AnAlternativeGeoAxes(fig, 111, ccrs.LambertConformal(central_longitude=0), region=(-60, 60, 30, 70))

    ax.add_cartopy_feature(land_50m)
    ax.add_cartopy_feature(countries)

    ax.set_xlabel('Longitude (\xb0)')
    ax.set_ylabel('Latitude (\xb0)')
    ax.set_title('Lambert Conformal')
    ax.grid()

    plt.savefig('lambert.png', dpi=300)
Really nice.
I planned to have a closer look to this approach and you did it for me!
How to manage to get it to work for non curvilinear projections like InterruptedGoodeHomolosine?
It's probably not alot of work to generalize it since I almost got it.
I agree, that does look like a nice approach.
I know in the past I've played around with floating axes and then when you go to an interactive mode the axis moves around with pan/zoom, so I'm not sure we want to go that route. I think you can get the GridHelper directly from axisartist without relying on floating:
https://matplotlib.org/stable/api/_as_gen/mpl_toolkits.axisartist.grid_helper_curvelinear.GridHelperCurveLinear.html#mpl_toolkits.axisartist.grid_helper_curvelinear.GridHelperCurveLinear
Can you then add the grid_helper directly to the subplot creation and add the axes_class=cartopy.mpl.geoaxes.GeoAxes keyword? That would hopefully keep the other GeoAxes plotting methods...
Sounds like a good idea, I will look into that. It might take some time as I am busying moving home recently.
Great addition, @blazing216!
Very much looking forward to this being available in Cartopy. It's a feature I've also been hoping for ever since I discovered M_Map for MATLAB, which produces similar maps: https://www.eoas.ubc.ca/~rich/map.html#2._Lambert_Conformal_Conic_projection_of
Dear @blazing2016,
I would like to thank you for your suggestions and proposals.
At the beginning of your initial comment of this Pull Request, you mentioned the existence of two approaches to implement curvilinear projections using matplotlib: projection and axisartists.
I have never heard of such approaches. Would you be so kind as to point to some references, and if possible, to some snip code examples supporting your statement?
It would be most helpful for me (and everyone else) to be capable of following along with your suggestions. Not only that but it may also help us in assisting you in your new GeoAxes proposal.
Sincerely,
Dear @PhilipeRLeal, I am sorry for the late reply. I have not found time to look into @greglucas's suggestion. Regarding the two approaches, here are several examples from matplotlib.org:
Projections: Hammer projection https://matplotlib.org/stable/gallery/misc/custom_projection.html?highlight=projection https://matplotlib.org/stable/gallery/subplots_axes_and_figures/geo_demo.html?highlight=projections
axisartists: https://matplotlib.org/stable/gallery/axisartist/demo_floating_axes.html?highlight=axisartists https://matplotlib.org/stable/tutorials/toolkits/axisartist.html?highlight=axisartists
Kind regards,
Hi guys, I tried what @greglucas suggested: using grid_helper without floating_axes. It works perfectly with zooming in/out, but probably we can only stay with rectangular map boundaries. However, it seems non-trivial to combine grid_helper with axes_class=cartopy.mpl.geoaxes.GeoAxes, because GeoAxes asks for certain map_projection but projection is not allowed to be provided with grid_helper. I am not quite familiar with the implementation of GeoAxes, maybe there is a workaround?
import matplotlib
#%matplotlib widget
from mpl_toolkits.axisartist.grid_helper_curvelinear import GridHelperCurveLinear
from mpl_toolkits.axisartist import angle_helper, Axes, HostAxes

from collections import OrderedDict

import cartopy.crs as ccrs
import cartopy.mpl.geoaxes as cgeoaxes

import cartopy.mpl.patch as cpatch
from cartopy.mpl.feature_artist import FeatureArtist, _freeze, _GeomKey


tr = cgeoaxes.InterProjectionTransform(ccrs.PlateCarree(),
        ccrs.LambertConformal(central_longitude=0))


class myFeatureArtist(FeatureArtist):
    def __init__(self, feature, **kwargs):
        super().__init__(feature, **kwargs)

    def draw(self, renderer, *args, **kwargs):
        """
        Draw the geometries of the feature that intersect with the extent of
        the :class:`cartopy.mpl.GeoAxes` instance to which this
        object has been added.

        """
        if not self.get_visible():
            return

        ax = self.axes
        feature_crs = self._feature.crs

        # Get geometries that we need to draw.
        extent = None
        try:
            extent = ax.get_extent(feature_crs)
        except ValueError:
            warnings.warn('Unable to determine extent. Defaulting to global.')
        except:
            #extent = ax.get_extent()

            # hard-coded
            extent = [-4036724.97527266, 4036724.97527266,
               -3951198.60336765, 527223.8051583]

        # print(extent)
        geoms = self._feature.intersecting_geometries(extent)

        # Combine all the keyword args in priority order.
        prepared_kwargs = dict(self._feature.kwargs)
        prepared_kwargs.update(self._kwargs)
        prepared_kwargs.update(kwargs)

        # Freeze the kwargs so that we can use them as a dict key. We will
        # need to unfreeze this with dict(frozen) before passing to mpl.
        prepared_kwargs = _freeze(prepared_kwargs)

        # Project (if necessary) and convert geometries to matplotlib paths.
        stylised_paths = OrderedDict()
        #key = ax.projection

        # hard-coded
        key = ccrs.LambertConformal(central_longitude=0)
        ax_projection = ccrs.LambertConformal(central_longitude=0)

        for geom in geoms:
            # As Shapely geometries cannot be relied upon to be
            # hashable, we have to use a WeakValueDictionary to manage
            # their weak references. The key can then be a simple,
            # "disposable", hashable geom-key object that just uses the
            # id() of a geometry to determine equality and hash value.
            # The only persistent, strong reference to the geom-key is
            # in the WeakValueDictionary, so when the geometry is
            # garbage collected so is the geom-key.
            # The geom-key is also used to access the WeakKeyDictionary
            # cache of transformed geometries. So when the geom-key is
            # garbage collected so are the transformed geometries.
            geom_key = _GeomKey(geom)
            FeatureArtist._geom_key_to_geometry_cache.setdefault(
                geom_key, geom)
            mapping = FeatureArtist._geom_key_to_path_cache.setdefault(
                geom_key, {})
            geom_paths = mapping.get(key)
            if geom_paths is None:
                if ax_projection != feature_crs:
                    projected_geom = ax_projection.project_geometry(
                        geom, feature_crs)
                else:
                    projected_geom = geom
                geom_paths = cpatch.geos_to_path(projected_geom)
                mapping[key] = geom_paths

            if not self._styler:
                style = prepared_kwargs
            else:
                # Unfreeze, then add the computed style, and then re-freeze.
                style = dict(prepared_kwargs)
                style.update(self._styler(geom))
                style = _freeze(style)

            stylised_paths.setdefault(style, []).extend(geom_paths)

        # transform = ax.projection._as_mpl_transform(ax)
        transform = ax.transData

        # Draw one PathCollection per style. We could instead pass an array
        # of style items through to a single PathCollection, but that
        # complexity does not yet justify the effort.
        for style, paths in stylised_paths.items():
            # Build path collection and draw it.
            c = matplotlib.collections.PathCollection(
                    paths,
                    transform=transform,
                    **dict(style))
            c.set_clip_path(ax.patch)
            c.set_figure(ax.figure)
            c.draw(renderer)

        # n.b. matplotlib.collection.Collection.draw returns None
        return None

import cartopy.feature as cfeature
land_50m = cfeature.NaturalEarthFeature('physical', 'land', '50m',
                                        edgecolor='face',
                                        facecolor=cfeature.COLORS['land'])
coastlines = cfeature.GSHHSFeature(scale='c', levels=[1], facecolor='gray')


class SimplestGeoAxesUsingGridHelper:
    def __init__(self):
        self.ax = fig.add_subplot(111, axes_class=HostAxes, grid_helper=GridHelperCurveLinear(tr))
        self.ax2 = self.ax.get_aux_axes(tr)
        self.ax.parasites.append(self.ax2)

    def add_artist(self, artist):
        self.ax.add_artist(artist)

def test1(fig):
    ax = SimplestGeoAxesUsingGridHelper()

    artist = myFeatureArtist(coastlines)
    ax.add_artist(artist)

    xy0 = tr.transform((-70,-20))
    xy1 = tr.transform((60,70))
    xy2 = tr.transform((60,-20))
    ax.ax.set_aspect(1.0)
    ax.ax.set_xlim(xy0[0], xy2[0])
    ax.ax.set_ylim(xy0[1], xy1[1])
    ax.ax.grid()


fig = plt.figure()
test1(fig)
 If we zoom in, the ticks and ticklabels are still correct.
 We can even zoom out after setting the xlim and ylim.

Sorry I hard-coded the projection and map extent into myFeatureArtist.draw for quick implementation.