Cartopy non-zero central longitude distorted with contourf
Description
I posted this on https://stackoverflow.com/questions/58920735/cartopy-non-zero-central-longitude-distorted-with-contourf and it was suggested that I open an issue here.
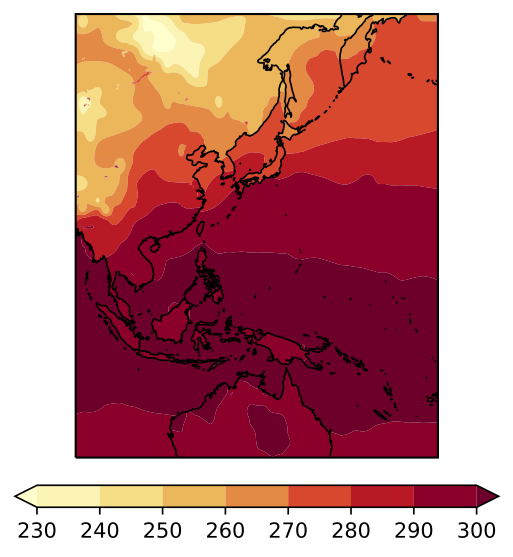
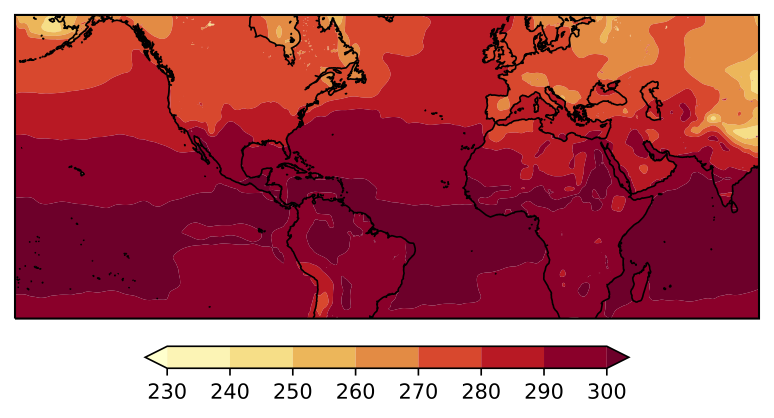
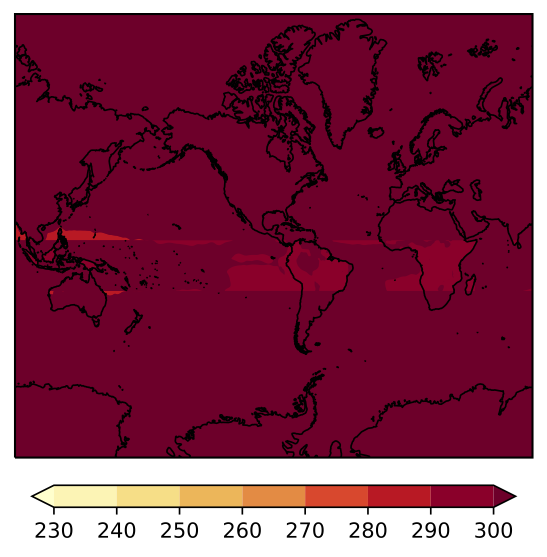
I am trying to plot the surface temperature from a NetCDF file using Cartopy and contourf. The domain of my plot is 30S to 60N and 90.044495E to 89.95552E (so all the way around the Earth centered on 90W). When I plot my figure, the filled contours are completely distorted over the map. I determined that the issue has to do with the transition across the longitude -180. When I plot from 90.04E-179E, my figure looks fine. And when I plot from 179W-89.9E my figure looks fine. If I try to plot the entire domain, I run into the distortion issue. I've included the figures below.
Code to reproduce
import numpy as np
import wrf as wrf
import matplotlib.pyplot as plt
import cartopy.crs as ccrs
cart_proj = wrf.get_cartopy(skintemp)
lats, lons = wrf.latlon_coords(skintemp)
ax = plt.axes(projection=cart_proj)
ax.coastlines('50m', linewidth=0.8)
clevels = np.linspace(230,300,8)
cmap = plt.cm.YlOrRd
contours_fill = plt.contourf(wrf.to_np(lons), wrf.to_np(lats), skintemp, cmap=cmap, levels = clevels, transform=ccrs.PlateCarree(),extend="both")
cbar = plt.colorbar(contours_fill, shrink = .65, orientation='horizontal', pad=.05)
plt.show()
Traceback
Full environment definition
Operating system
Cartopy version
Cartopy version 0.17.0 Matplotlib version 3.1.1 (if that's helpful)
conda list
pip list
Would it be possible to link to your datafile somewhere so we can try to reproduce? Otherwise, this will be next to impossible to figure out.
The file is ~1G so I can't attach it here. I'm attaching a numpy array of the variable and numpy arrays for the latitudes and longitudes. Please let me know if this will be sufficient. Using the following code (where cart_proj = wrf.projection.MercatorWithLatTS) reproduces the issue for me:
import numpy as np
import matplotlib.pyplot as plt
import cartopy.crs as ccrs

skintemp = np.load('skintemp.npy')
lats = np.load('lats.npy')
lons = np.load('lons.npy')

ax = plt.axes(projection=cart_proj)
ax.coastlines('50m', linewidth=0.8)
clevels = np.linspace(230,300,8)
cmap = plt.cm.YlOrRd
contours_fill = plt.contourf(lons, lats, skintemp, cmap=cmap, levels = clevels, transform=ccrs.PlateCarree(),extend="both")
cbar = plt.colorbar(contours_fill, shrink = .65, orientation='horizontal', pad=.05)
plt.show()
skintemp.npy.gz lats.npy.gz lons.npy.gz
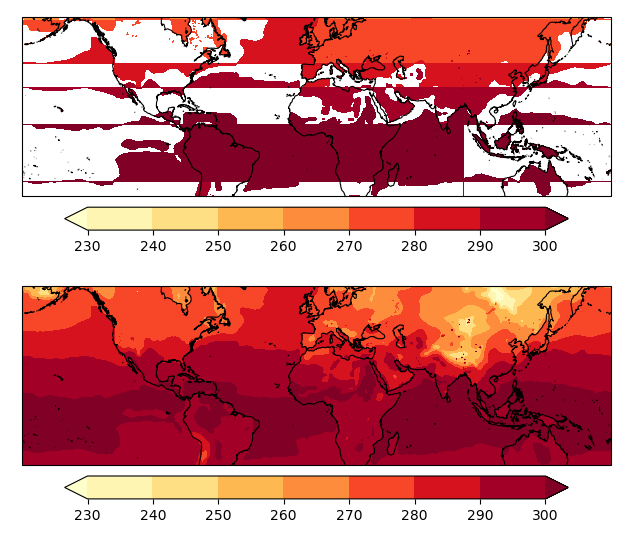
I think this one should be fixed by the z_masked_overlap function presented in issue #1421
The result with the code below:
import numpy as np
import numpy.ma as ma
import matplotlib.pyplot as plt
import cartopy.crs as ccrs

def z_masked_overlap(axe, X, Y, Z, source_projection=None):
    """
    for data in projection axe.projection
    find and mask the overlaps (more 1/2 the axe.projection range)

    X, Y either the coordinates in axe.projection or longitudes latitudes
    Z the data
    operation one of 'pcorlor', 'pcolormesh', 'countour', 'countourf'

    if source_projection is a geodetic CRS data is in geodetic coordinates
    and should first be projected in axe.projection

    X, Y are 2D same dimension as Z for contour and contourf
    same dimension as Z or with an extra row and column for pcolor
    and pcolormesh

    return ptx, pty, Z
    """
    if not hasattr(axe, 'projection'):
        return Z
    if not isinstance(axe.projection, ccrs.Projection):
        return Z

    if len(X.shape) != 2 or len(Y.shape) != 2:
        return Z

    if (source_projection is not None and
            isinstance(source_projection, ccrs.Geodetic)):
        transformed_pts = axe.projection.transform_points(
            source_projection, X, Y)
        ptx, pty = transformed_pts[..., 0], transformed_pts[..., 1]
    else:
        ptx, pty = X, Y


    with np.errstate(invalid='ignore'):
        # diagonals have one less row and one less columns
        diagonal0_lengths = np.hypot(
            ptx[1:, 1:] - ptx[:-1, :-1],
            pty[1:, 1:] - pty[:-1, :-1]
        )
        diagonal1_lengths = np.hypot(
            ptx[1:, :-1] - ptx[:-1, 1:],
            pty[1:, :-1] - pty[:-1, 1:]
        )
        to_mask = (
            (diagonal0_lengths > (
                abs(axe.projection.x_limits[1]
                    - axe.projection.x_limits[0])) / 2) |
            np.isnan(diagonal0_lengths) |
            (diagonal1_lengths > (
                abs(axe.projection.x_limits[1]
                    - axe.projection.x_limits[0])) / 2) |
            np.isnan(diagonal1_lengths)
        )

        # TODO check if we need to do something about surrounding vertices

        # add one extra colum and row for contour and contourf
        if (to_mask.shape[0] == Z.shape[0] - 1 and
                to_mask.shape[1] == Z.shape[1] - 1):
            to_mask_extended = np.zeros(Z.shape, dtype=bool)
            to_mask_extended[:-1, :-1] = to_mask
            to_mask_extended[-1, :] = to_mask_extended[-2, :]
            to_mask_extended[:, -1] = to_mask_extended[:, -2]
            to_mask = to_mask_extended
        if np.any(to_mask):

            Z_mask = getattr(Z, 'mask', None)
            to_mask = to_mask if Z_mask is None else to_mask | Z_mask

            Z = ma.masked_where(to_mask, Z)

        return ptx, pty, Z


lats = np.load('lats1400.npy', allow_pickle=False)
lons = np.load('lons1400.npy', allow_pickle=False)
skintemp = np.load('skintemp1400.npy', allow_pickle=False)

fig = plt.figure(figsize=(10, 6.4), dpi=100)
axe = fig.add_subplot(2, 1, 1, projection=ccrs.Mercator())
axe.coastlines('50m', linewidth=0.8)
clevels = np.linspace(230,300,8)
cmap = plt.cm.YlOrRd
contours_fill = plt.contourf(lons, lats, skintemp, cmap=cmap,
                             levels = clevels, transform=ccrs.PlateCarree(),
                             extend="both")
cbar = plt.colorbar(contours_fill, shrink = .65, orientation='horizontal', pad=.05)

axe = fig.add_subplot(2, 1, 2, projection=ccrs.Mercator())
X, Y, masked_skintemp = z_masked_overlap(
    axe, lons, lats, skintemp,
    source_projection=ccrs.Geodetic())
axe.coastlines('50m', linewidth=0.8)
clevels = np.linspace(230,300,8)
cmap = plt.cm.YlOrRd
contours_fill = plt.contourf(X, Y, masked_skintemp, cmap=cmap,
                             levels = clevels,
                             extend="both")
cbar = plt.colorbar(contours_fill, shrink = .65, orientation='horizontal', pad=.05)


plt.show()