cartopy

cartopy copied to clipboard
Empty streamline plots
Description
Streamline plots for this case generate empty figures:
Code to reproduce
import numpy as np
import cartopy.crs as ccrs
import matplotlib.pyplot as plt

x = np.array([233., 236.83146159, 240.66292318, 244.49438477])
y = np.array([28., 31.645003, 35.290006, 38.935009])
u = np.array(
      [[ 0.03955199, -0.22247993, -0.25873835,  0.04202399],
       [-0.23483805,  0.09814767, -0.10702853,  np.nan],
       [ 0.21835904,  0.06390616, np.nan,       np.nan],
       [ 0.19803461,  np.nan,     np.nan,       np.nan]]
)
v = np.array(
    [[-0.0986053 ,  0.05887021, -0.25543633, -0.20215461],
     [ 0.11536164, -0.11004942, -0.01419378, np.nan],
     [-0.06482275, -0.35679315, np.nan,      np.nan],
     [ 0.16507462, np.nan,      np.nan,      np.nan]]
)
ax = plt.subplot(projection=ccrs.PlateCarree())
ax.streamplot(x, y, u, v)
This works:
x = plt.subplot()
plt.streamplot(x, y, u, v)
and this seems to work around it:
    from cartopy.vector_transform import vector_scalar_to_grid
    from matplotlib.axes import Axes

    ax = plt.subplot(projection=ccrs.PlateCarree())
    new_x, new_y, new_u, new_v, = vector_scalar_to_grid(ccrs.PlateCarree(),
        ccrs.PlateCarree(), 5, x, y, u, v)

    Axes.streamplot(ax, new_x, new_y, new_u, new_v, transform=ccrs.PlateCarree())
Taken from Stack Overflow.
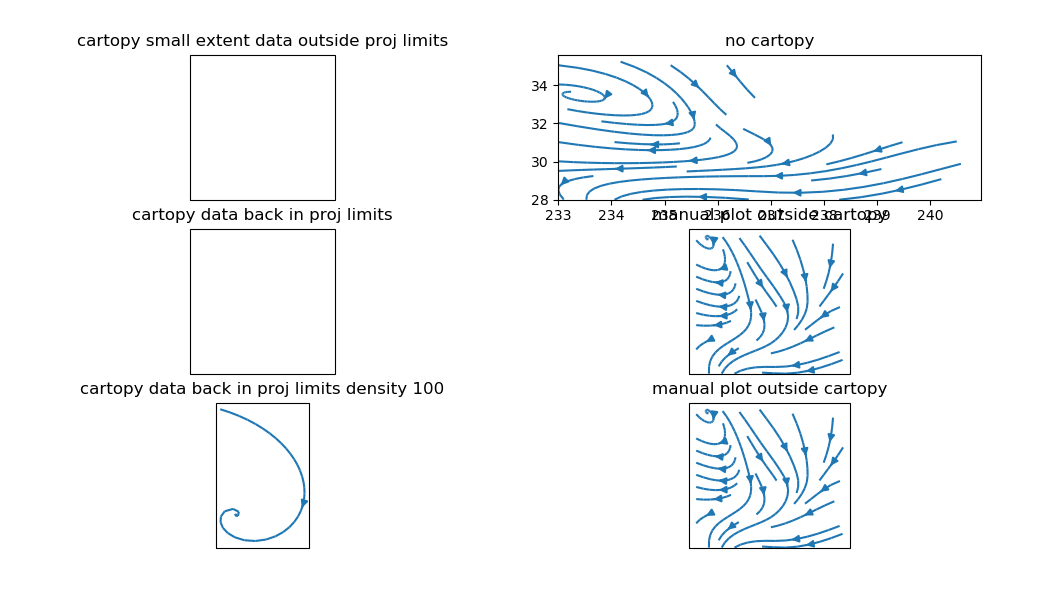
It seems there are two issues.
- the data is out of the projection limits ( x > 180)
- cartopy regrids the data in the full projection extent -180, 180, -90, 90, which at the default density doesn't provides enough valid data for a plot.
The next figure shows on the left, how the data appears once it is put back inside the projection limits and with a density high enough. But it takes a long time.
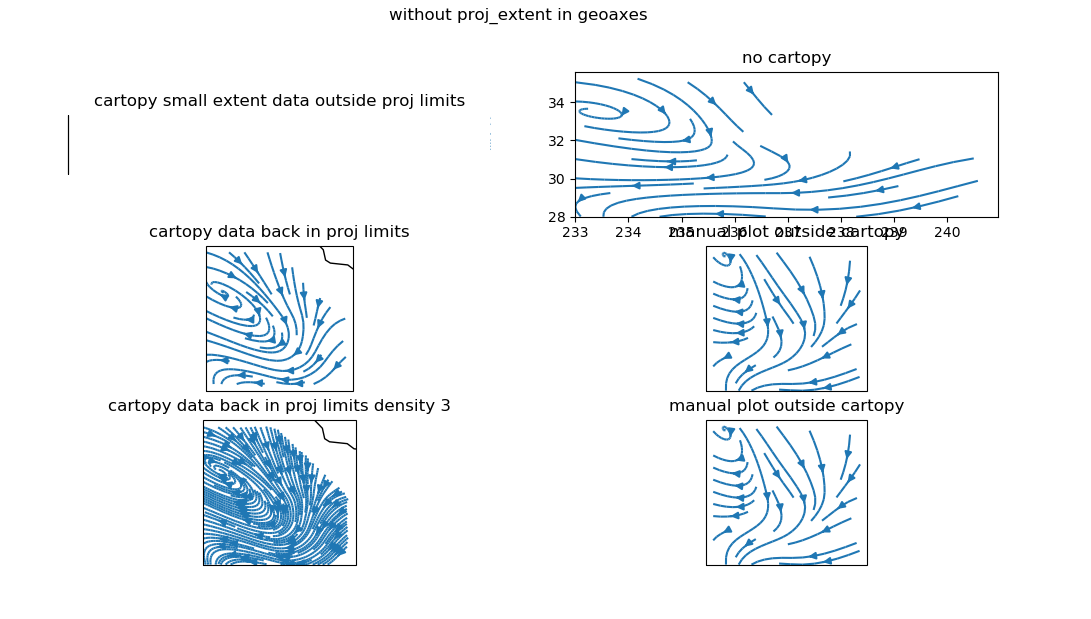
The same plots after removing the extent (target_extent) in geoaxes before regrid:
        target_extent = self.get_extent(self.projection)
        gridded = vector_scalar_to_grid(t, self.projection, regrid_shape,
                                        x, y, u, v, *scalars,
         #                               target_extent=target_extent
                                        )
And the code to reproduce:
import numpy as np
import cartopy.crs as ccrs
from cartopy.vector_transform import vector_scalar_to_grid
import matplotlib.pyplot as plt
from matplotlib.axes import Axes
import matplotlib.gridspec as gridspec

plt.figure()
x = np.array([233., 236.83146159, 240.66292318, 244.49438477])
y = np.array([28., 31.645003, 35.290006, 38.935009])
u = np.array(
      [[ 0.03955199, -0.22247993, -0.25873835,  0.04202399],
       [-0.23483805,  0.09814767, -0.10702853,  np.nan],
       [ 0.21835904,  0.06390616, np.nan,       np.nan],
       [ 0.19803461,  np.nan,     np.nan,       np.nan]]
)
v = np.array(
    [[-0.0986053 ,  0.05887021, -0.25543633, -0.20215461],
     [ 0.11536164, -0.11004942, -0.01419378, np.nan],
     [-0.06482275, -0.35679315, np.nan,      np.nan],
     [ 0.16507462, np.nan,      np.nan,      np.nan]]
)
fig = plt.figure(figsize=(12, 6.4), dpi=100)
#fig.suptitle('without proj_extent in geoaxes')
gs = gridspec.GridSpec(3, 2, figure=fig)

ti2=''
for i in range(3):
    for j in range(2):
        if (i, j) == (0, 1):
            axe = fig.add_subplot(gs[i, j])
            axe.set_title('no cartopy')
            plt.streamplot(x, y, u, v)
            continue
        elif (i, j) == (0, 0):
            axe = fig.add_subplot(gs[i, j], projection=ccrs.PlateCarree())
            axe.set_title('cartopy small extent data outside proj limits')
            axe.streamplot(x, y, u, v)
        elif i == 2:
            axe = fig.add_subplot(gs[i, j], projection=ccrs.PlateCarree())
            if j == 0:
                density = 100
                axe.set_title('cartopy data back in proj limits density {}'.format(density))
                axe.streamplot(x, y, u, v,
                               transform=ccrs.PlateCarree(
                                       central_longitude=0),
                               density = density)
            else:
                axe.set_title('manual plot outside cartopy')
                new_x, new_y, new_u, new_v, = vector_scalar_to_grid(
                        ccrs.PlateCarree(),
                        ccrs.PlateCarree(), 5, x, y, u, v )
                Axes.streamplot(axe, new_x, new_y, new_u, new_v, transform=ccrs.PlateCarree())

        elif i > 0:
            axe = fig.add_subplot(gs[i, j], projection=ccrs.PlateCarree())
            if j == 0:
                axe.set_title('cartopy data back in proj limits')
                # the transform ccrs.PlateCarree(central_longitude=0)
                # force reprojection to have coordinates in the
                # projection limits; ccrs.PlateCarree() would not work.
                axe.streamplot(x, y, u, v,
                               transform=ccrs.PlateCarree(
                                       central_longitude=0))
            else:
                axe.set_title('manual plot outside cartopy')
                new_x, new_y, new_u, new_v, = vector_scalar_to_grid(
                        ccrs.PlateCarree(),
                        ccrs.PlateCarree(), 5, x, y, u, v )
                Axes.streamplot(axe, new_x, new_y, new_u, new_v, transform=ccrs.PlateCarree())


        axe.coastlines()
plt.show()
The critical item is to call set_extent with tight limits before calling streamplot. Otherwise streamplot calculates streamlines over the full globe.