Reporting-Services-examples
 Reporting-Services-examples copied to clipboard
:closed_book: Various example reports I use for Microsoft Report Server (SSRS & PBIRS) as well as documents for unit testing, requirements and a style guide template.

Microsoft SQL Server Reporting Services (SSRS)
The following examples are used to query the database & report server. I have included some useful scripts and documents as well.
File List
Miscellaneous
Documentation
- Report Requirements
- Report Style Guide
- Report Unit Testing Checklist
Scripts
- Apply Standard Header and Footer
- Backup Deployed Reports
- Candy Stripe
- Heat Map Color
- Heat Map Color Gradate
- Update Subscription Owner
Reports
Database Server
- Activity Monitor
- Database Dictionary
- Job Search
- Scheduled Jobs
Report Server
- Data Sources
- Execution Log
- Heat Map Calendar (using execution log)
- Permissions
- Report Documentation
- Report List
- Subscriptions
Data Dictionary
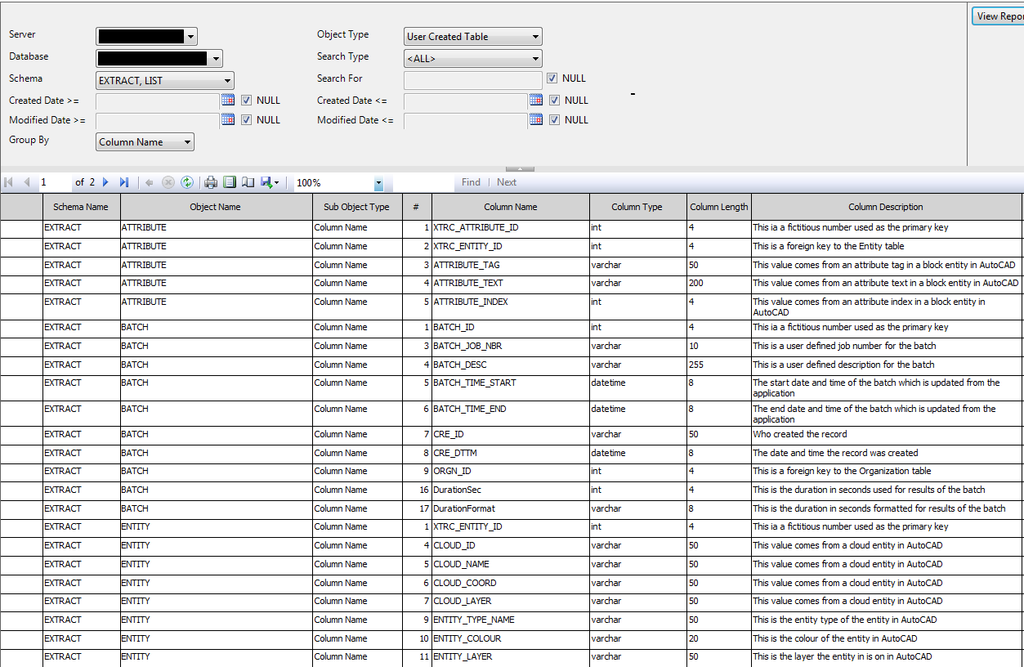
This report is used for querying the data dictionary of a SQL Server database. |
Scheduled Jobs Gantt Chart
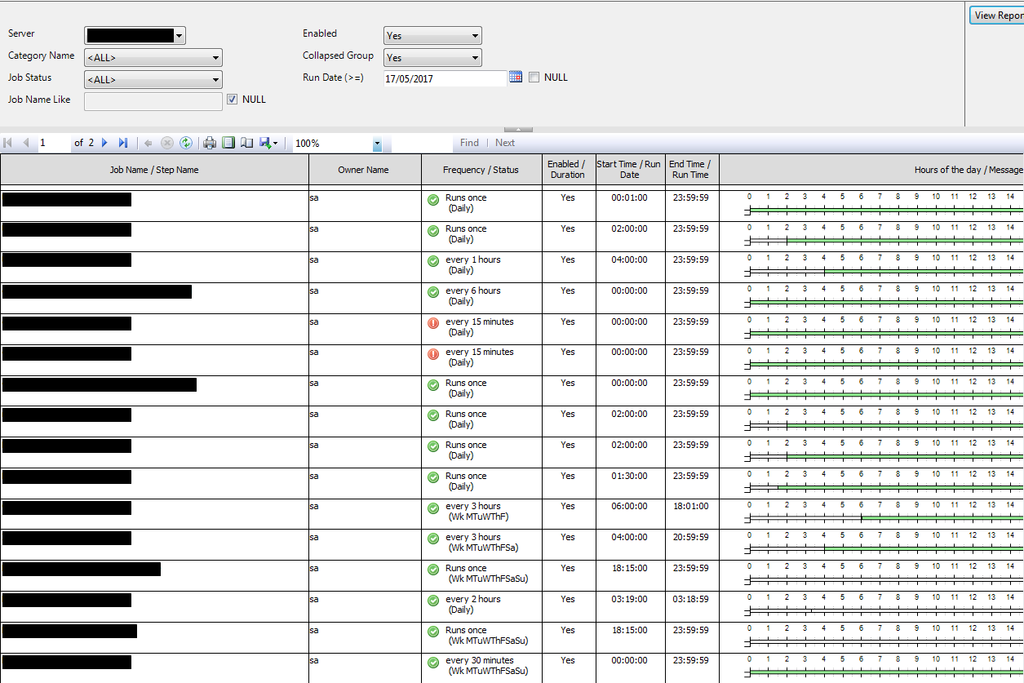
This report is used for querying the scheduled jobs for a SQL Server database. |
Activity Monitor

This report queries the activity monitor from SQL Server. |
Report Listing
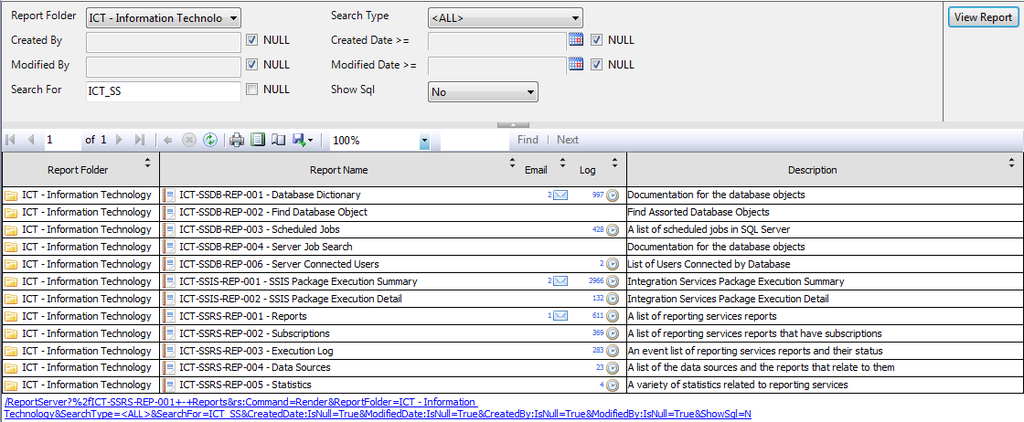
This report is used for querying the deployed SSRS reports, their subscriptions and their execution logs. |
Report Subscriptions

This report is used for querying the deployed SSRS subscriptions. |
Report Execution Log
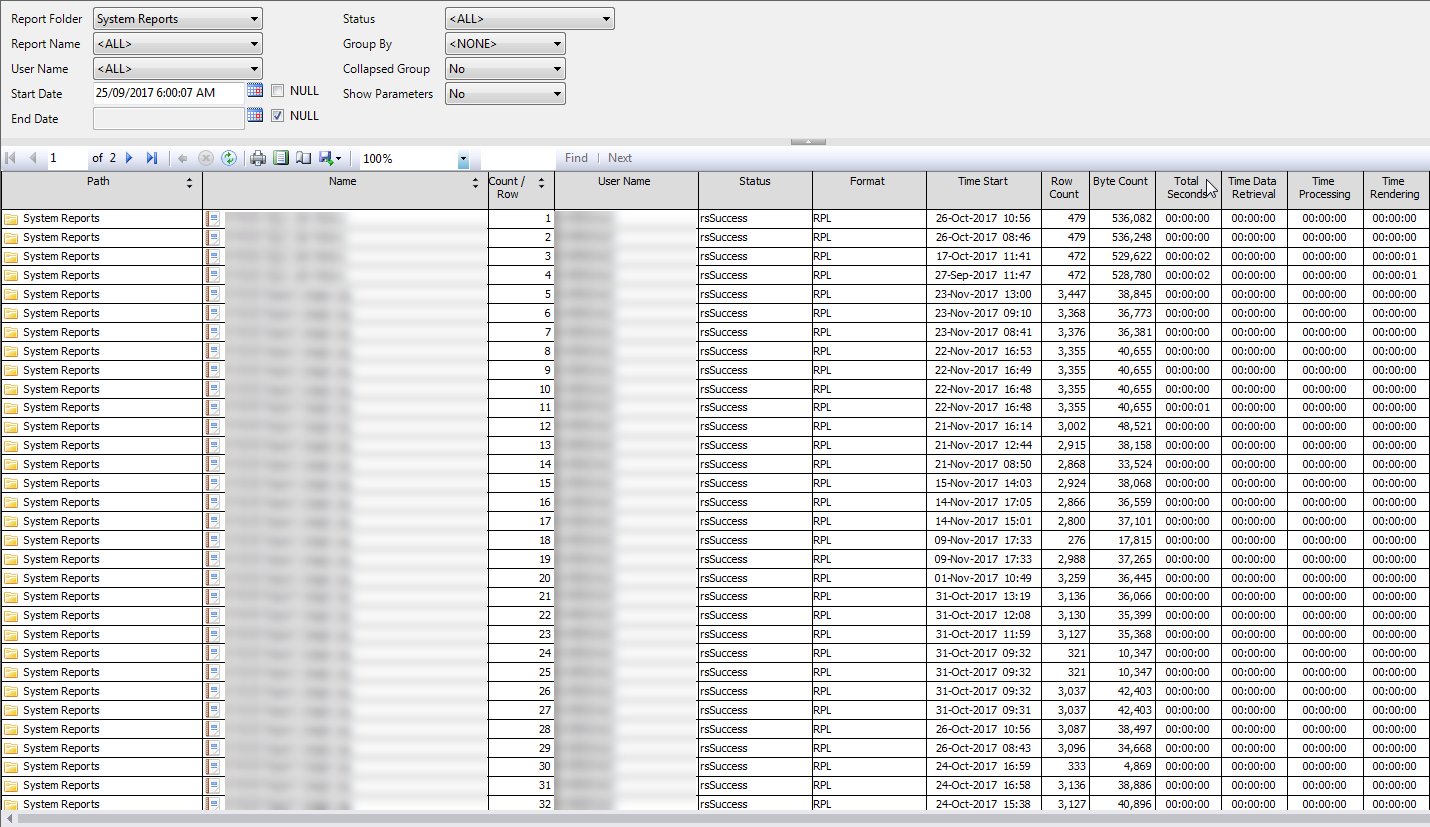
This report is used for querying the report server exection log table. |
Report Documentation
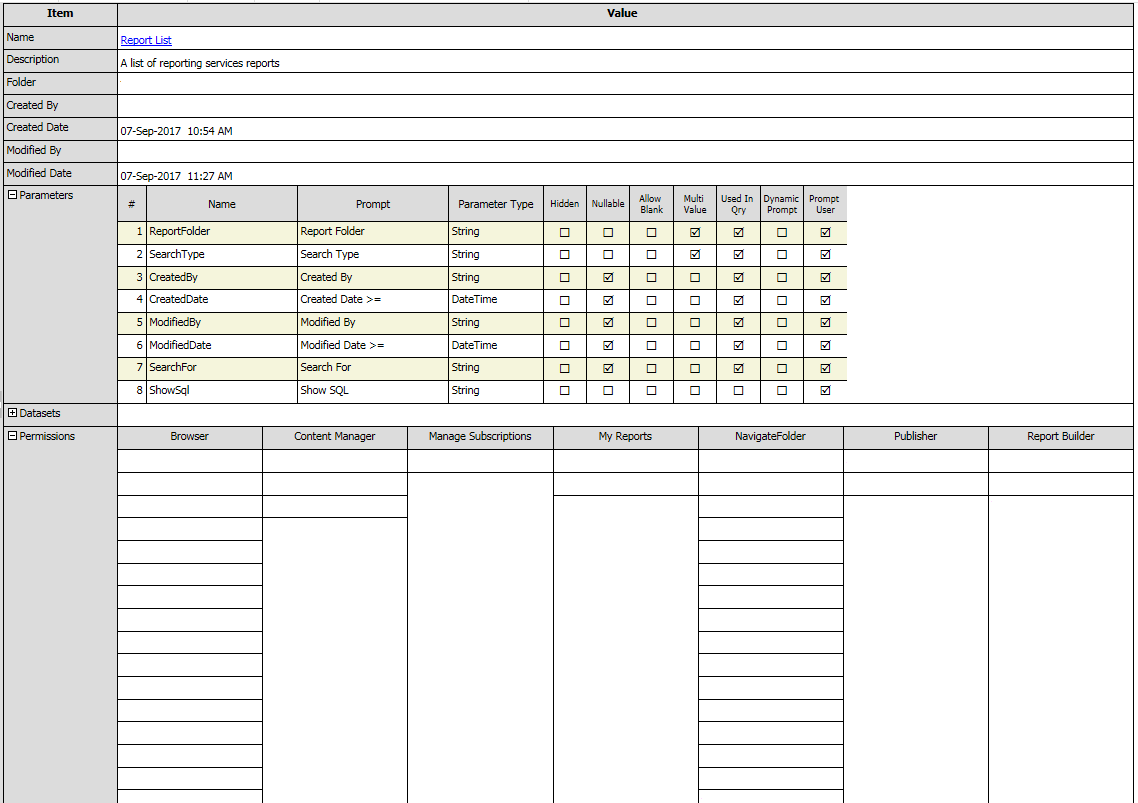
This report is used for querying the deployed report XML. |
Report Data Sources
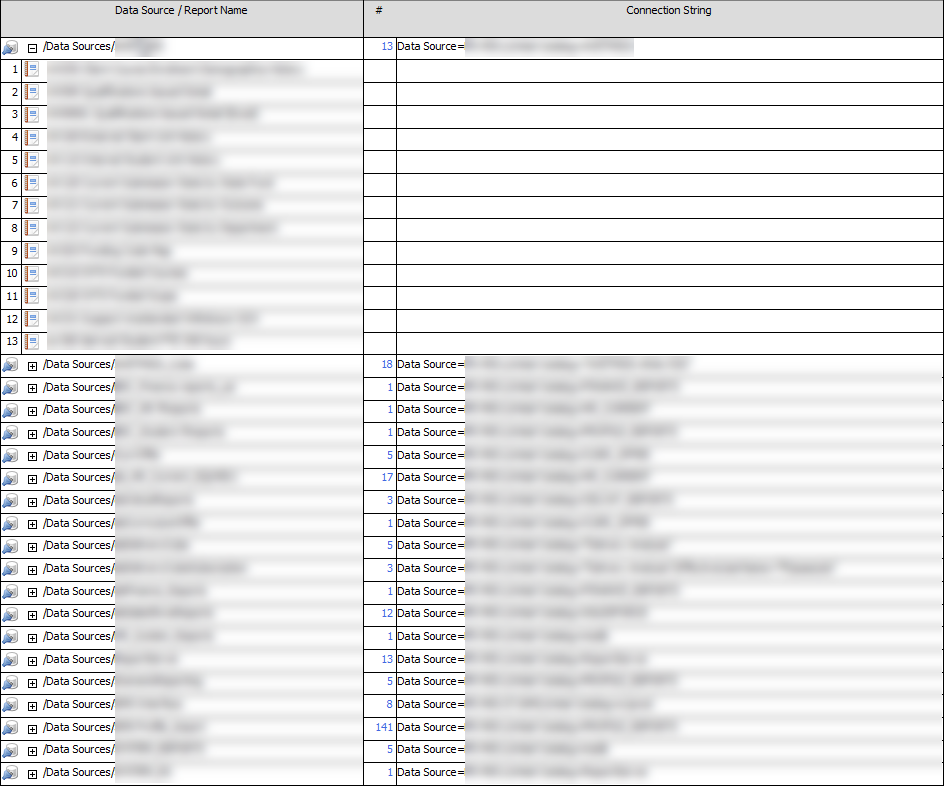
This report is used for querying the deployed data sources. |
Report Server Folder Permissions
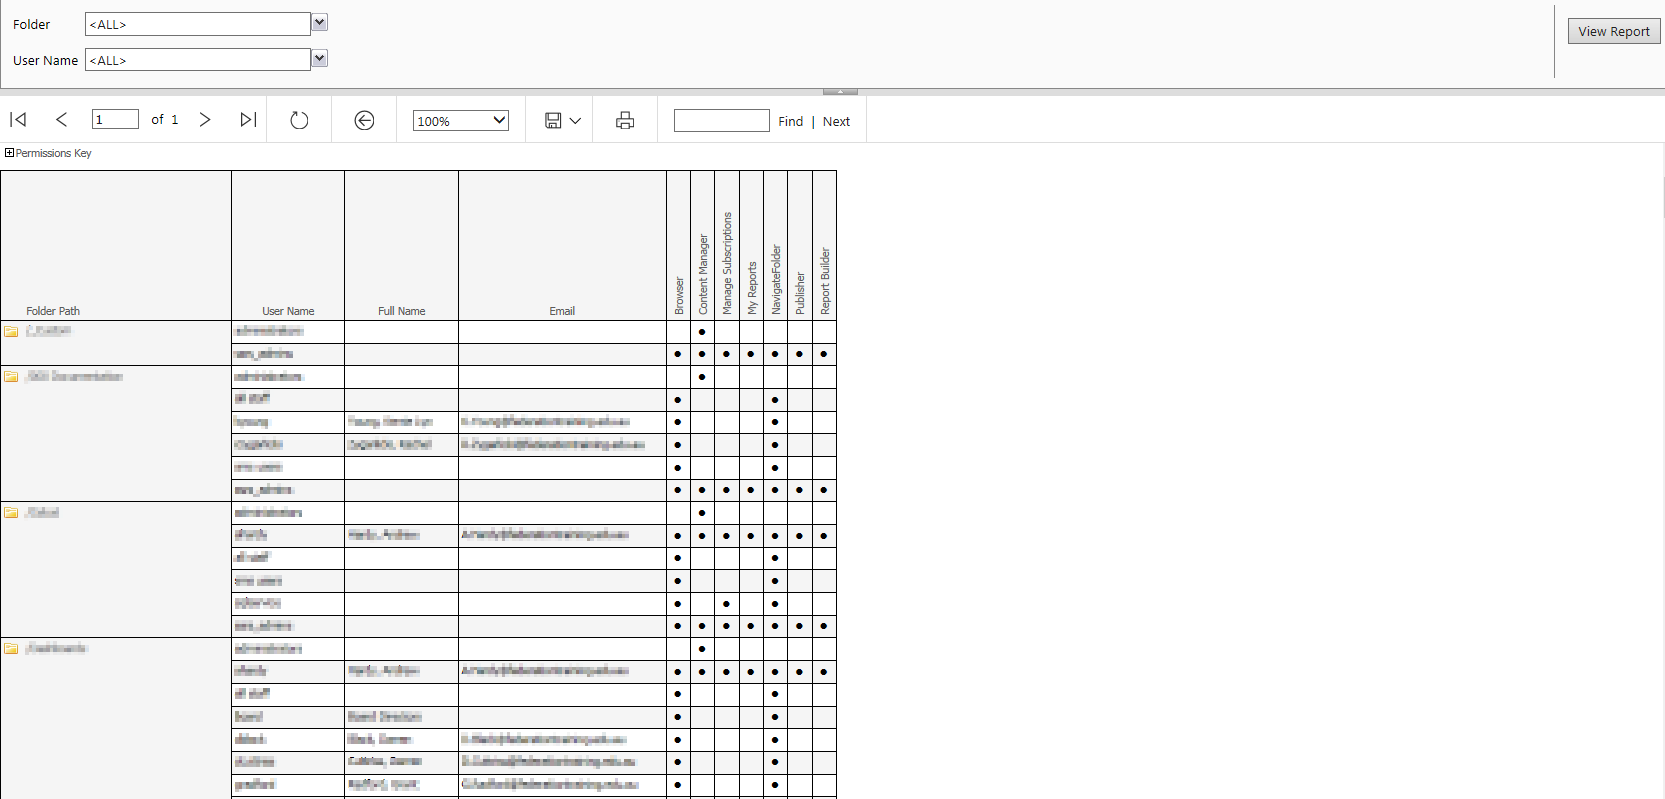
This report is used for querying the report server folder permissions. |
Heat Map Calendar

The report uses a nested tablix inside of a matrix to show a calendar view. The heat map is implemented using a function with a report variable for the base color to produce a gradients of the color. Each day on the calendar can be hyperlinked to a detailed Reporting Services report. |


