Vignette Example doesn't show graphs
I'm copy-pasting the example here: https://rinterface.github.io/shinyMobile/reference/f7TabLayout.html and the app runs, but the graphs do not show.
There is also the following error showing in DevTools:
app.js:34 Uncaught TypeError: Cannot read properties of null (reading 'name') at HTMLDocument.
(app.js:34:27) at HTMLDocument.dispatch (jquery.min.js:2:43064) at v.handle (jquery.min.js:2:41048) at Object.trigger (jquery.min.js:2:71515) at HTMLDocument. (jquery.min.js:2:72110) at Function.each (jquery.min.js:2:3003) at S.fn.init.each (jquery.min.js:2:1481) at S.fn.init.trigger (jquery.min.js:2:72086) at e.value (inputEventDecorator.ts:38:37) at e.value (inputRateDecorator.ts:63:19)
Here's my session info:
R version 4.1.2 (2021-11-01)
Platform: aarch64-apple-darwin20 (64-bit)
Running under: macOS Monterey 12.2.1

Matrix products: default
LAPACK: /Library/Frameworks/R.framework/Versions/4.1-arm64/Resources/lib/libRlapack.dylib

locale:
[1] en_US.UTF-8/en_US.UTF-8/en_US.UTF-8/C/en_US.UTF-8/en_US.UTF-8

attached base packages:
[1] stats     graphics  grDevices utils     datasets  methods   base

other attached packages:
[1] shinyWidgets_0.7.0 shiny.pwa_0.2.1    shinyMobile_0.9.1  shiny_1.7.1.9003

loaded via a namespace (and not attached):
 [1] Rcpp_1.0.8.3     pillar_1.7.0     compiler_4.1.2   bslib_0.3.1
 [5] later_1.3.0      jquerylib_0.1.4  tools_4.1.2      digest_0.6.29
 [9] jsonlite_1.8.0   lifecycle_1.0.1  tibble_3.1.7     pkgconfig_2.0.3
[13] rlang_1.0.3      cli_3.3.0        rstudioapi_0.13  fastmap_1.1.0
[17] withr_2.5.0      vctrs_0.4.1      sass_0.4.1       hms_1.1.1
[21] triebeard_0.3.0  glue_1.6.2       R6_2.5.1         fansi_1.0.3
[25] readr_2.1.2      tzdb_0.3.0       magrittr_2.0.3   urltools_1.7.3
[29] promises_1.2.0.1 ellipsis_0.3.2   htmltools_0.5.2  mime_0.12
[33] xtable_1.8-4     httpuv_1.6.5     utf8_1.2.2       cachem_1.0.6
[37] crayon_1.5.1
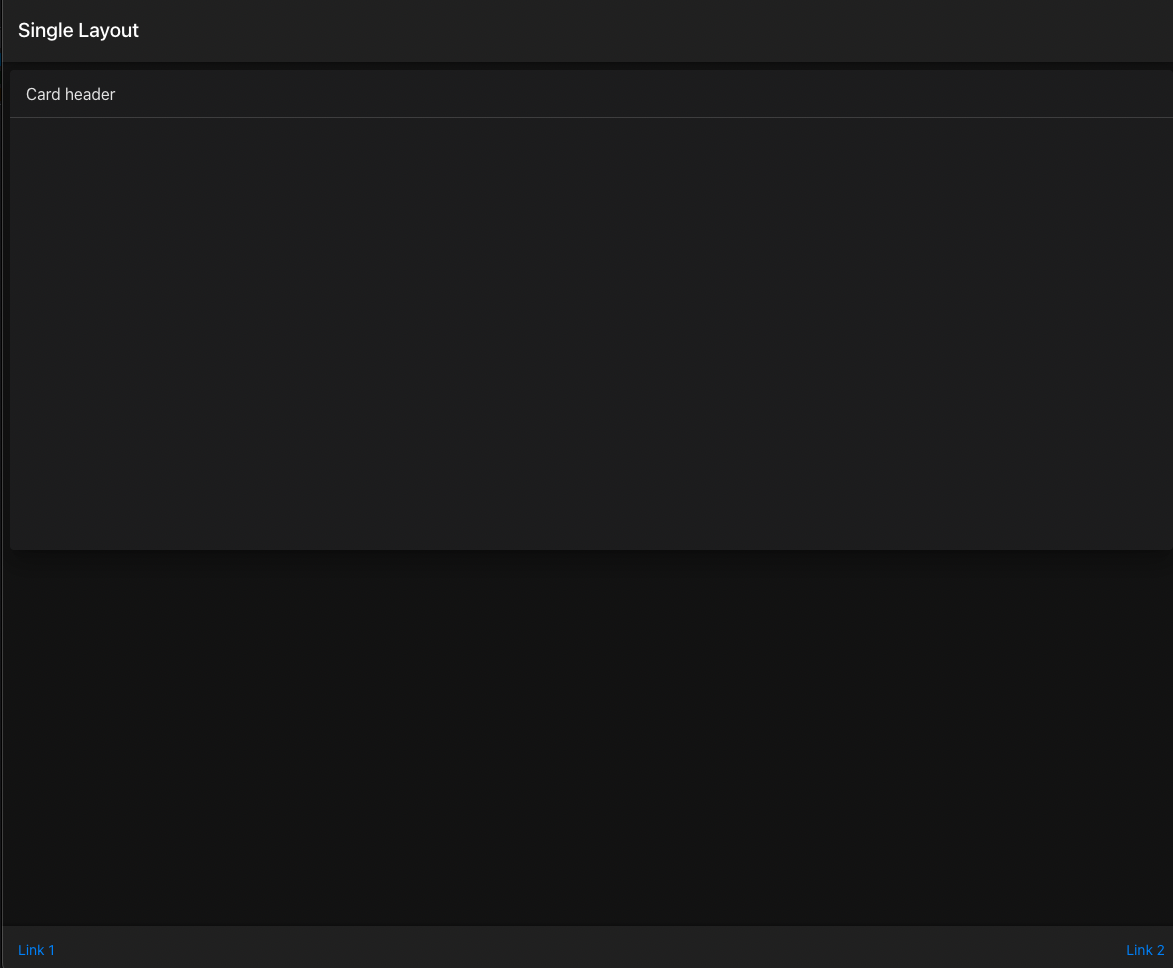
The example here also fails to render any charts:
https://rinterface.github.io/shinyMobile/articles/Single-Layout.html
Hi,
Is this still an issue? I see you are using shiny_1.7.1.9003 which is a development version.
I just reinstalled shinyMobile and apexcharts and the issue remains -- here's what I see:
Great. The example seems to work as expected!
For others: I un-installed the existing shinyMobile package and then re-installed the relevant github branch with devtools::install_github("RinteRface/[email protected]").