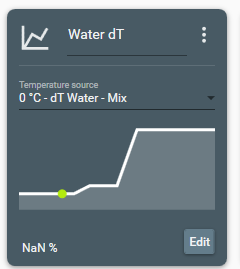
Graph showing NaN% instead of 0
Configuration Details:
I have a Custom Sensor which takes the Water Temp Out (Pass through on the exit of the block before the rad), and subtracts Water Temp In (Sensor is on my water Pump), to get the delta-T (change in temp) for the loop.
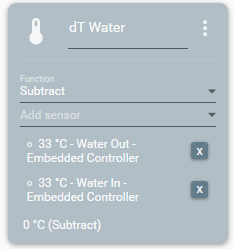
This Custom Sensor is then used in a graph to control the temp for the pump.
Often, if I have the pump running 75% or higher, the water is flowing fast enough that there is no detectable difference (it takes only 2-3s by my calculation to have the whole loop's volume cycle the loop).
Not sure if this is expected, as in this case 0C is actually an expected value (I could even see -1 if I had a sudden decrease in use), not an error.
Right now 0 and below are unexpected values, hence the NaN. I plan to change that soon to make your kind of scenario work.