IronOS
 IronOS copied to clipboard
Power output as bar graph rather than percentage value
Graphical representation is easier and quicker to grasp than an abstract numerical percentage value.
-
I'm submitting a ...
- [X] Feature request
-
What is the current behavior?
- Power output displayed as percentage value: 65%
-
What is the expected behavior?
- Power output displayed as bar graph, i.e. as seen in JBL power bar sample.
- related issue #31
- result inconclusive, a fw w/ a bar graph patch is mentioned but not linked.
- does master branch feature this power bar graph? is it reachable from the config menu?
Hi, that feature was in the 1.x firmwares and was not bought forward into the 2.x firmwares because its usability was fairly terrible, since there isn't a high resolution display on the unit and a large portion of the time it was either tiny, or completely full.
So when I did the re-write I didn't port this feature over as it didn't provide any more indication that just having heating on indicators.
Ok, thx for the clarification.
I'd favor a port, though. To me it is important to not only know the binary "heating on" but to know how hard (read: how much) the tip gets driven by PWM or simply power output for that matter.
It is an issue to be able to tell whether it is heating and at the same time have a quantitative guess at how much heat has to be "generated", as in "right now".
Hi, I'm not sure why this got closed. I'm still interested in the feature, others might be, too.
I could get interested in implementing it, with a little heads up to speed up the learning curve of the src code organisation.
Regarding the low resolution, we could do with a horizontal 1px wide bar. That way, there's much more resolution available.
What do you think about it?
cheers
Hi, I'm not sure why this got closed. I'm still interested in the feature, others might be, too. Yeah shouldn't have closed this one :/
I could get interested in implementing it, with a little heads up to speed up the learning curve of the src code organisation.
Regarding the low resolution, we could do with a horizontal 1px wide bar. That way, there's much more resolution available.
What do you think about it?
I'm not particular on size, but it would be desired to work on both soldering screen layouts i suspect.
The code to modify is here: workspace/TS100/Core/Src/OLED.cpp
I would add a function to the OLED driver to draw the bar, that either takes in dimensions for location and %age, or hard code location if the same location works on both screen layouts.
Note that at the moment I haven't built out functions for setting individual pixels in the screen buffer as it hasn't been required yet. But this code can be taken from any other oled driver basically.
Once a funciton for drawing to the OLED has been made, hook it in like this function does to calculate the remaining time.
@corbolais Have you tested the latest release? Do you still need this feature? If not please consider closing this issue? 😊
thanks
@discip Hi there, haven't tested the latest release yet. Some news about this feature? Basically, I'd still like to see it implemented, I'm just not getting along time-wise.
@corbolais No there are no changes in this regard, but maybe you are pleased with all the other new implementations enough to be able to overcome the need for a bar graph. 😊
@corbolais
Have you had time to test the latest release?
Especially with Detailed solder screen activated?
Maybe this will make you happy enough to close this issue for good. 😊
@discip Thanks for the ping. Haven't tested it yet, though. But sounds great! Closing for now. Thanks again.
@corbolais I really don't want to bother you ... but the issue is still open. 😀
@corbolais
- you have to click the purple button at the bottom to close this ticket.
- if you go into User Interface > and turn on Detailed Idle and Detailed Solder, there is a lot better information you might like.
- if you get a Pinecil V2 iron, it has Bluetooth BLE, then could use Joric's BLE API on a browser or PineSAM app and they both have very nice displays of Power to watts and can be used to also control pinecil iron at the same time.
- since all the iron screens are very small in size, I think for Accessibility issues, the real alternative is BLE bluetooth Browser apps which people can view in Huge size on Monitor or like I do on phone which is plenty big for me and I tap on the phone to change the Pinecil iron Temperatures. (only for newest V2 pinecil though has BLE).
- the BLE apps are pretty fast at updating with V2 pinecil so it's rather fun to use in Color and any kind of graph or bar could be implemented. Joric's BLE Api is a graph and the PineSAM app can completely control Pinecil V2, but doesn't have a graph yet.
- anyone is able to help code in PineSAM to help implement a power bar graph as well just submit a PR.
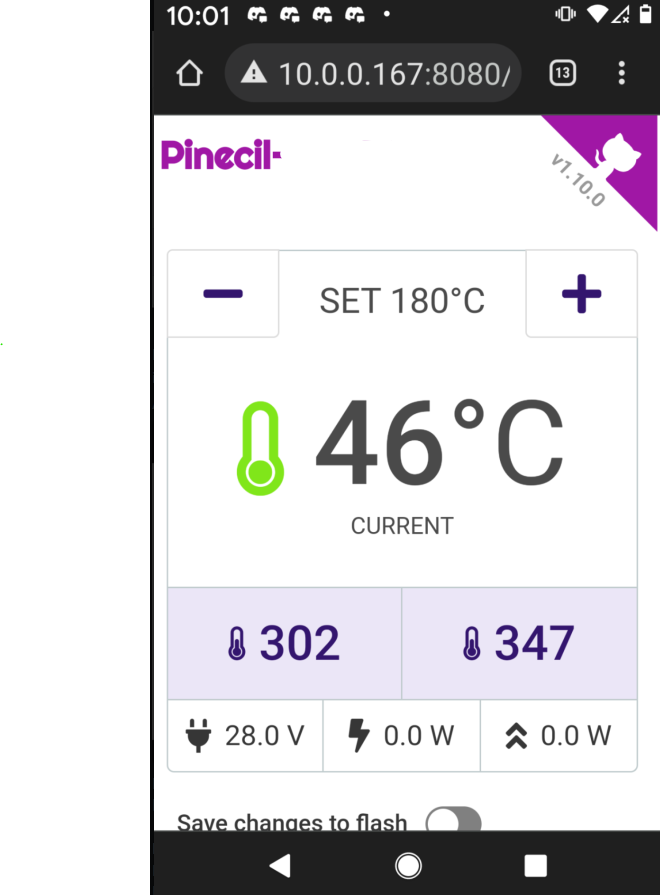
I'm not sure which Iron you have but this is an example of the kind of accessibility visually that Pinecil V2 could help people with.
-
This is an example of exactly how PineSAM BLE bluetooth app looks on my phone when I'm running newest Pinecil V2 soldering Iron.
-
it has great visibillity over what you get on tiny Iron screen, works in Dark or Light mode, and those buttons were made big enough so you can tap them even with nitrile gloves on. I personally tested the phone buttons for this as originally they were too small. works on Ipad/ iphone/ Android if I run the script from my PC/macOS/linux.
-
PineSAM also has features the irons don't give you like two PRESET buttons you can customize.
if anyone uses PineSAM and prefers Power in a bar instead of a number, just submit a ticket or code it and submit a PR. it might be able to fit into this main Work HUD view or it's possible maybe it could fit in with the new Graph view that is coming.
This is screenshot right from my actual phone. This is only one single work screen, it also has screen to change all settings on Pinecil V2 as well.