vscode-R
 vscode-R copied to clipboard
Plot not rendered correctly when using `abline` in combination with `layout`
Description
Not sure if I am missing something here, but it seems that the plot rendering is not working as expected when creating a new plot after abline in the context of a custom layout.
Reproduction
To reproduce, please run the following code:
# Seed.
set.seed(123)

# Data.
x <- rnorm(100)
y <- rnorm(100)
y_cumulative <- cumsum(y)

# Set layout.
layout(matrix(1:2, 2, 1))

# Plot daily downloads.
plot(x, y)
abline(h = mean(x))

# Plot cumulative downloads.
plot(x, y_cumulative)

# Reset layout.
layout(1:1)

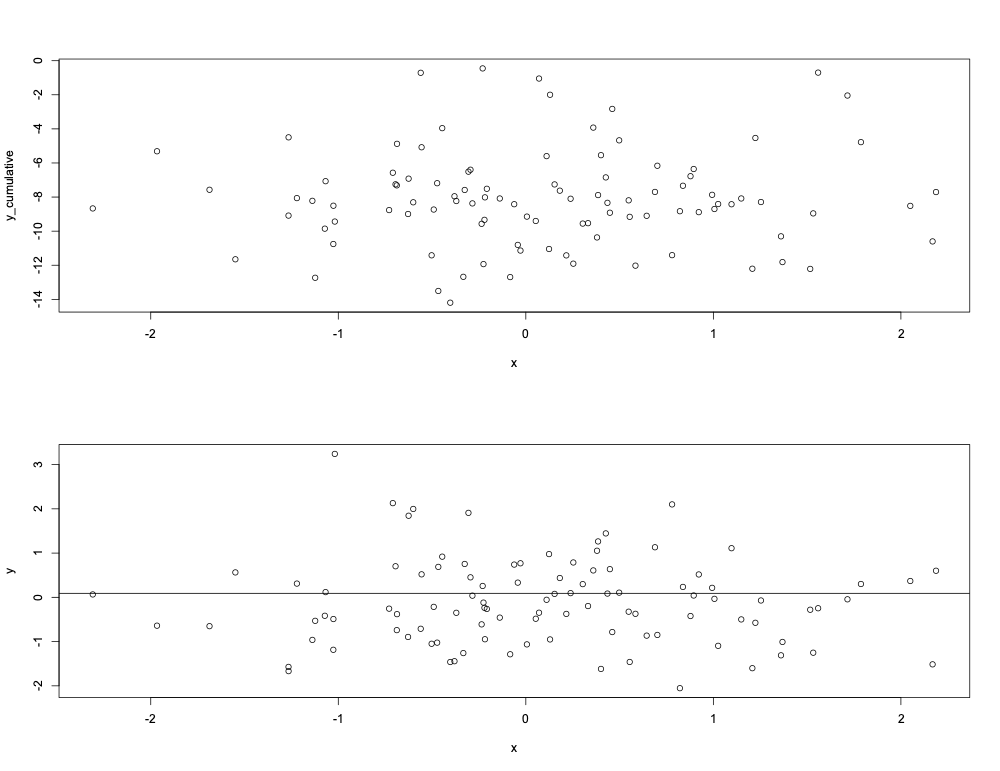
It seems that swapping the order of the plots produces the expected output, i.e.:
# Set layout.
layout(matrix(1:2, 2, 1))

# Plot cumulative downloads.
plot(x, y_cumulative)

# Plot daily downloads.
plot(x, y)
abline(h = mean(x))

# Reset layout.
layout(1:1)
Environment (please complete the following information):
- OS: macOS
- VSCode Version: 1.67.2
- R Version: 4.1.2
- vscode-R version: 2.5.0
- httpgd version: 1.3.0
@mihaiconstantin Thanks for reporting this (and @renkun-ken thanks for the ping). I can confirm this is a bug in httpgd. It seems to be an issue with clipping. I will investigate.
Should be fixed now: https://github.com/nx10/httpgd/commit/ba471a11dd546ca1ab06381deb9acbef89dcad36