rustworkx
 rustworkx copied to clipboard
[joss] Solving simple tasks
This is not a bug report, but a request to review my solution to a few simple tasks using retworkx. Most of these tasks were thought up before I looked at retworkx at all, and they help me judge how usable the library is.
Forgive my horrible Python—I'm not fluent in this language, as you can see. I'd especially appreciate comments on whether these tasks have a simpler / better solution in retworkx.
import retworkx as rx
from retworkx.visualization import mpl_draw

import numpy as np
import matplotlib.pyplot as plt
Plot the degree distribution of a graph
n = 10000
g = rx.undirected_gnm_random_graph(n, 2*n)

degs = [g.degree(v) for v in g.node_indexes()]

plt.hist(degs, bins=range(max(degs)+1))
Getting the degree sequence seemed a bit more verbose than what I expected. Is there a simpler way?
Giant component transition
n = 10000
xx = np.arange(0, 2, 0.01)
res = []
for x in xx:
    g = rx.undirected_gnm_random_graph(n, round(x*n))
    gcsize = max(map(len, rx.weakly_connected_components(g.to_directed())))
    res.append(gcsize)

plt.plot(xx, res)
There seems to be no connected components function for undirected graphs, so we convert to directed first.
Isolate the giant component
n = 100
g = rx.undirected_gnm_random_graph(n, n)

gcomp = max(rx.weakly_connected_components(g.to_directed()), key=len)
g = g.subgraph(list(gcomp))
Compute the node betweenness and store it in a node attribute
betw = rx.betweenness_centrality(g)

for v, c in betw.items():
    g[v] = {'betweenness': c}
Will this format for attribute storage become standard in the future? Suppose you add importers for various graph file formats. Most can store named attributes. It seems to me that if the library is meant to be usable for network analysis, it won't be possible to avoid standardizing on some attribute storage format.
Mean neighbour degree
from statistics import mean

mean_nei_degs = []
for v in g.node_indexes():
    mean_nei_degs.append(mean([g.degree(u) for u in g.neighbors(v)]))

print(mean_nei_degs)
Undirected connected components from scratch
from collections import deque, defaultdict

def conn_comps(graph: rx.PyGraph):
    membership = [0] * graph.num_nodes() # membership[v] is the 1-based component index of vertex v
    component_index = 0
    queue = deque()

    for v in range(graph.num_nodes()):
        if not membership[v]:
            # we do a BFS for each not-yet-visited vertex

            component_index += 1

            queue.append(v)
            membership[v] = component_index
            while queue:
                u = queue.popleft()
                for w in graph.neighbors(u):
                    if not membership[w]:
                        queue.append(w)
                        membership[w] = component_index

    comps = defaultdict(set)
    for i, c in enumerate(membership):
        comps[c-1].add(i)

    return comps
n = 20
g = rx.undirected_gnm_random_graph(n, n)

print(conn_comps(g))
I was looking to program a Dijsktra as well, but I'm not sure how to get the incident edge list, a critical ingredient. See #509
Targeted attack
Remove nodes in order of highest betweenness, and record in what order they were removed.
This would be much more interesting for edges and edge betweenness (it would implement Girvan-Newman community detection), but edge betweenness is not yet available. See also #512
def betw_order(graph):
    g = graph.copy()

    for i in range(g.num_nodes()):
        g[i] = i # payload keeps track of which node was which during removals

    order = []

    while g.num_nodes() > 0:
        betw = rx.betweenness_centrality(g)
        top_node = max(betw, key=lambda key: betw[key])

        order.append(g[top_node])
        g.remove_node(top_node)

    return order
n = 20
g = rx.undirected_gnm_random_graph(n, 3*n)

betw_order(g)
Visualize centrality measures
Betweenness
g = rx.generators.grid_graph(7,7)

betw = rx.betweenness_centrality(g)
mpl_draw(g, node_color=[betw[v] for v in g.node_indexes()])
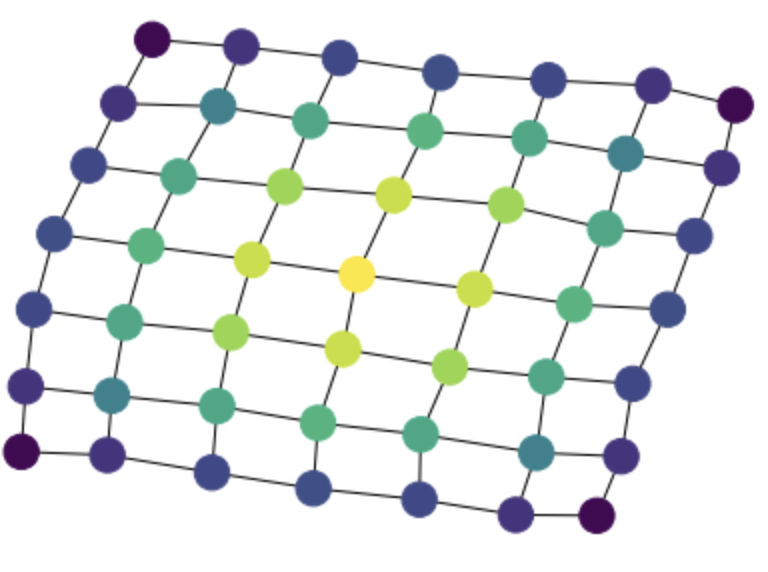
Here, one comment is that the result is returned as a dictionary between vertex indices and centrality values. It takes extra work to convert this to the list representation required by mpl_draw(). I am wondering if the dictionary is the best return format for retworkx. networkx does it because it does not have consistent vertex and edge orderings, but in retworkx vertex and edge indices are important, and appear to be the best way to refer to vertices/edges.
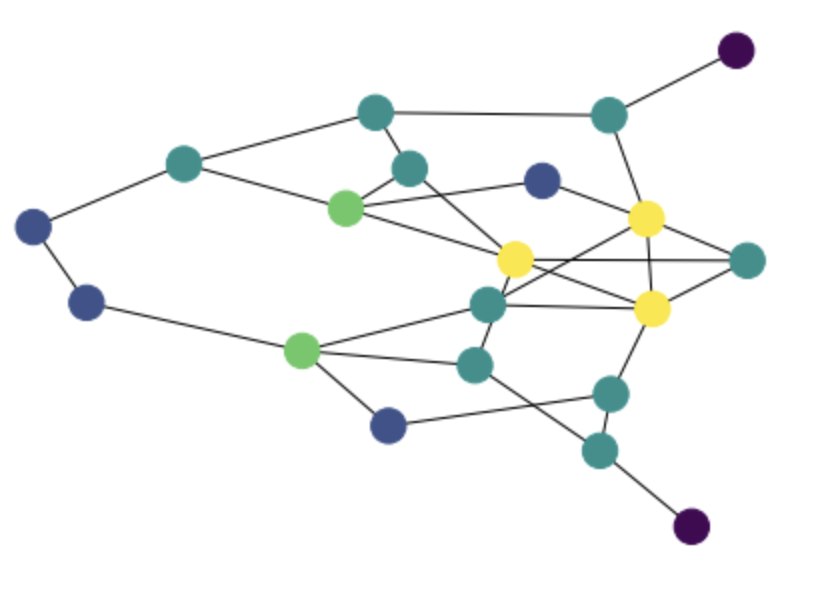
Degree
g = rx.undirected_gnm_random_graph(20, 30)

degs = [g.degree(i) for i in g.node_indexes()]
mpl_draw(g, node_color = np.array(degs) / max(degs))
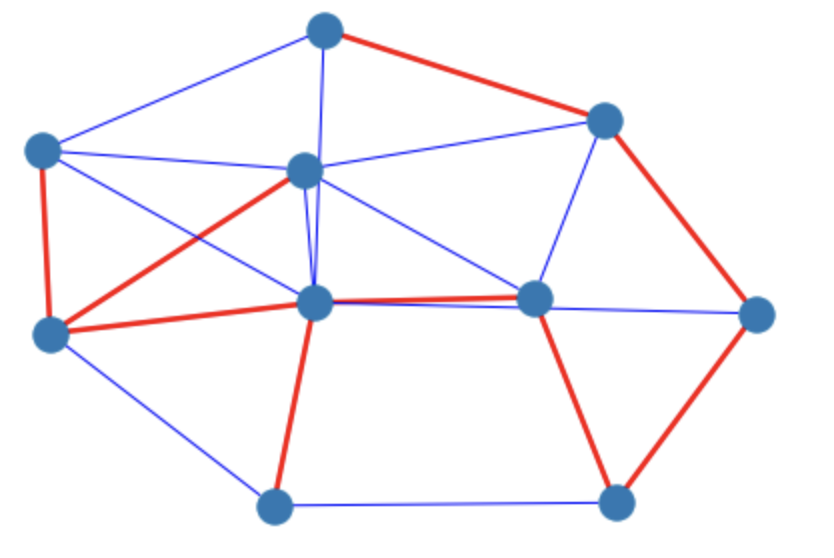
Highlight a spanning tree
g = rx.undirected_gnm_random_graph(10,20)
spanning_edges = rx.minimum_spanning_edges(g)
print(spanning_edges)
We need to convert these edges specifications to indices in some way so that they can be used for plotting. Is there a simpler way to do this? See #512.
ei = g.edge_index_map()
edges_to_indices = dict(zip(ei.values(), ei.keys()))

cols = ['blue'] * g.num_edges()
widths = [1] * g.num_edges()
for edge in spanning_edges:
    cols[edges_to_indices[edge]] = 'red'
    widths[edges_to_indices[edge]] = 2.5
mpl_draw(g, edge_color = cols, width=widths)
I now realize that many of these solutions are incorrect because I assumed that node/edge with index i is the ith edge. However, this is not the case. I should have noticed this when @mtreinish told me that retworkx uses StableGraph from petgraph.
Solutions looks mostly fine. The only caveat is that you should replace range(g.num_nodes()) with g.node_indexes() since as you noticed, after node/edge removals there isn't any guarantee that indices are contiguous. This is the reason that functions like betweenness_centrality return a dictionary.
Compute the node betweenness and store it in a node attribute
Are you suggesting that betweenness_centrality should store the result in a node attribute? Having a flexible node data payload that can store any Python object is a design choice for retworkx and I don't see a strong reason for standardizing it. We can easily support named attributes, exactly as you did, with a dictionary of the form {"name": value}. But I'm probably missing something here, so I'd love to hear your thoughts on this.
Mean neighbour degree
It should be more efficient to pre-compute and store the degree of each node.
Undirected connected components from scratch
In the next release, there will be a bfs_search function https://github.com/Qiskit/retworkx/blob/main/retworkx/init.py#L1789 that allows to customize the BFS traversal, so the following is an alternative approach.
class ConnectedComponentsVisitor(rx.visit.BFSVisitor):

    def __init__(self):
        self._membership = dict()
        self._comp_index = 0

    def discover_vertex(self, v):
        if v not in self._membership:
            self._comp_index += 1
            self._membership[v] = self._comp_index

    def tree_edge(self, edge):
        _source, target, _payload = edge
        self._membership[target] = self._comp_index

    @property
    def connected_components(self):
        comps = defaultdict(set)
        for i, c in self._membership.items():
            comps[c - 1].add(i)

        return comps


n = 20
g = rx.undirected_gnm_random_graph(n, n)
vis = ConnectedComponentsVisitor()
rx.bfs_search(g, source=None, visitor=vis)
conn_comps = vis.connected_components
Highlight a spanning tree
A simpler approach:
graph = rx.undirected_gnm_random_graph(10, 20)
spanning_edges = {(u, v) for u, v, _ in rx.minimum_spanning_edges(graph)}
edge_colors = [
    "red" if edge in spanning_edges else "blue" for edge in graph.edge_list()
]

mpl_draw(graph, edge_color = edge_colors)