code-d
 code-d copied to clipboard
Profiling integration with valgrind
See talk http://dconf.org/2022/index.html#vijayn and http://dconf.org/2021/online/index.html#max
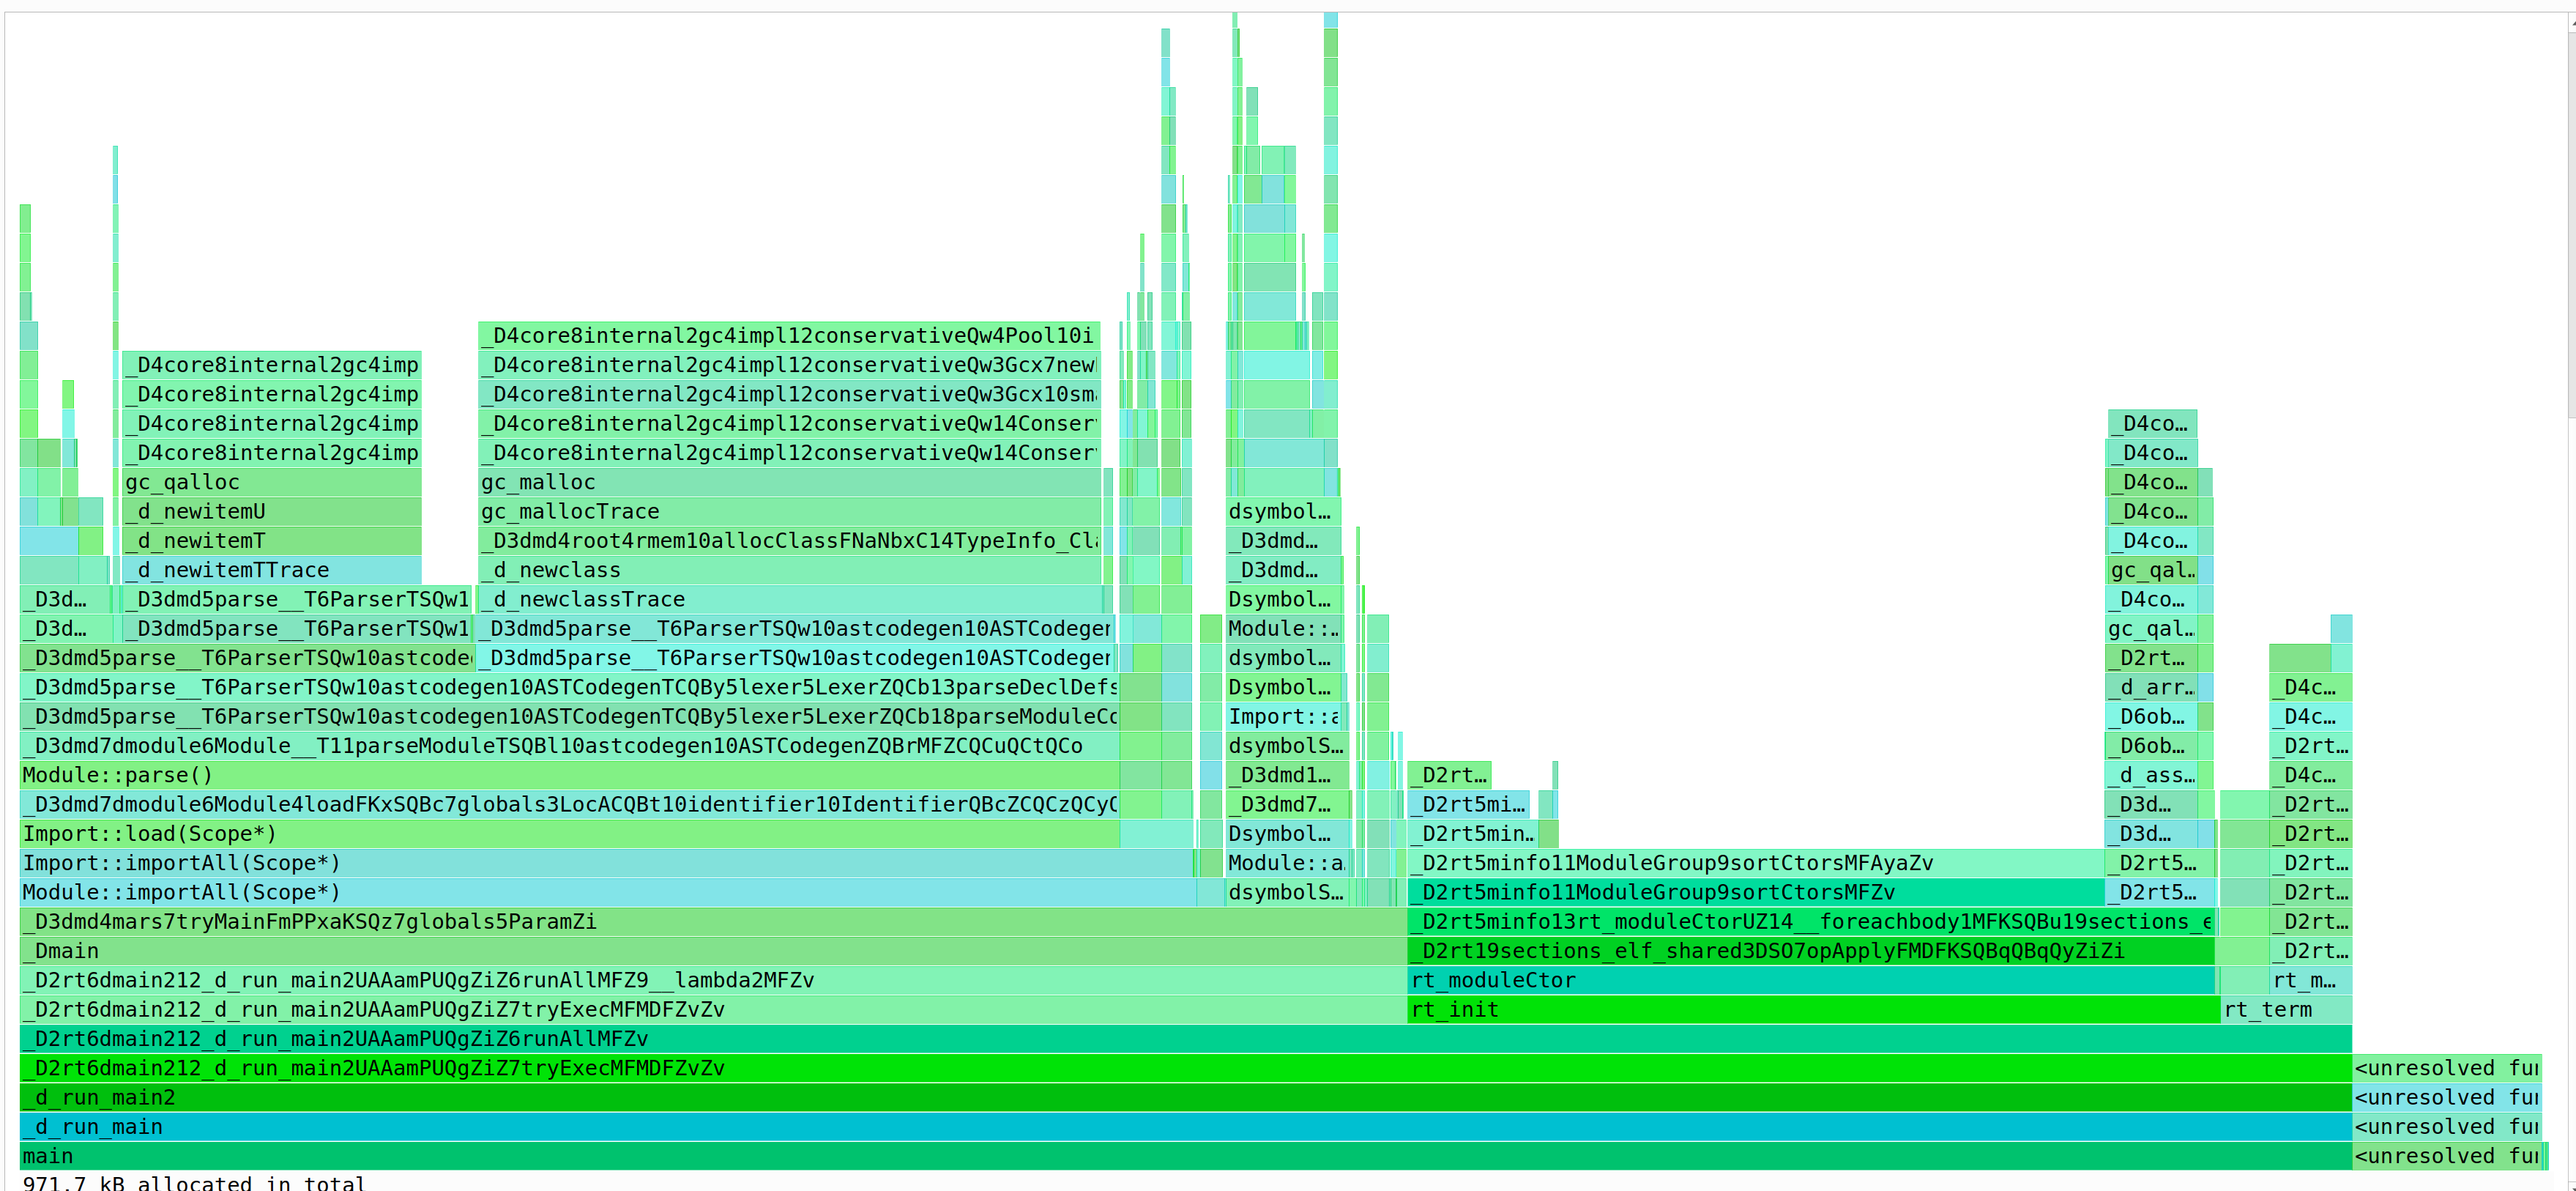
Valgrind and heaptrack data formats and reports are both fairly easy to parse so a visual overlay like the profile=gc might be nice.
Point out how to do the code-d side and I can write the support code for you.
first need to decide on the specific UI how it is going to look in the UI, then to implement it in serve-d we need to check with the LSP documentation what standard APIs are offered and then decide if we use that standard or if a proprietary extension with glue code in code-d will offer more benefits for now.
The apple ecosystem profiler (instruments) could be integrated as well. The basic data neeed for any tool is homogenous, you just need to implement some parser.
feep showed me perf yesterday, maybe interesting here too.
We might want to put this in a separate extension from code-d as well, make it possible to use it with other languages as well. I can add it as dependency to code-d so it gets installed from with there as well.
perf is very powerful but surprisingly hard to use reliably from other tooling. long story.
to keep it simple I would really recommend we should start another extension and not try to put it into code-d
how about implementing something like https://marketplace.visualstudio.com/items?itemName=MaxMedia.go-prof ?
another one: https://marketplace.visualstudio.com/items?itemName=Xuhpclab.drcctprof-vscode-extension
benchmarking and profiling are different but I think it's probably doable to automate both. talk soon
bytes allocated, allocations, type, function, file:line
         800640	            197	void[] dmd.root.rmem.Mem.xcalloc src/dmd/root/rmem.d:58
         648048	           1761	dmd.dscope.Scope dmd.dscope.Scope.alloc src/dmd/dscope.d:159
         518320	           2945	dmd.mtype.TypeIdentifier dmd.root.rmem.allocClass src/dmd/root/rmem.d:232
         493200	            841	void[] dmd.root.rmem.Mem.xmalloc_noscan src/dmd/root/rmem.d:50
         447216	           5692	void[] dmd.root.rmem.Mem.xmalloc src/dmd/root/rmem.d:42
         394128	            483	dmd.func.FuncDeclaration dmd.root.rmem.allocClass src/dmd/root/rmem.d:232
         385968	            473	dmd.func.FuncDeclaration dmd.parse.Parser!(ASTCodegen, Lexer).Parser.parseDeclarations src/dmd/parse.d:4577
         370128	           2103	dmd.mtype.TypeIdentifier dmd.parse.Parser!(ASTCodegen, Lexer).Parser.parseBasicType src/dmd/parse.d:3672
         220432	            599	dmd.declaration.VarDeclaration dmd.root.rmem.allocClass src/dmd/root/rmem.d:232
         208080	            255	dmd.func.UnitTestDeclaration dmd.parse.Parser!(ASTCodegen, Lexer).Parser.parseDeclDefs src/dmd/parse.d:530
         208080	            255	dmd.func.UnitTestDeclaration dmd.root.rmem.allocClass src/dmd/root/rmem.d:232
         159984	           3333	dmd.expression.IdentifierExp dmd.root.rmem.allocClass src/dmd/root/rmem.d:232
         159168	           3316	dmd.expression.IdentifierExp dmd.parse.Parser!(ASTCodegen, Lexer).Parser.parsePrimaryExp src/dmd/parse.d:7935
         150512	            409	dmd.dtemplate.TemplateInstance dmd.root.rmem.allocClass src/dmd/root/rmem.d:232
         130304	            509	dmd.declaration.AliasDeclaration dmd.root.rmem.allocClass src/dmd/root/rmem.d:232
         123264	            963	dmd.mtype.TypeFunction dmd.root.rmem.allocClass src/dmd/root/rmem.d:232
         105984	            288	dmd.declaration.VarDeclaration dmd.parse.Parser!(ASTCodegen, Lexer).Parser.parseDeclarations src/dmd/parse.d:4660
          98880	           1030	dmd.tokens.Token dmd.lexer.Lexer.allocateToken src/dmd/lexer.d:214
          94576	            257	dmd.dtemplate.TemplateDeclaration dmd.root.rmem.allocClass src/dmd/root/rmem.d:232
          92448	            963	dmd.expression.DotIdExp dmd.root.rmem.allocClass src/dmd/root/rmem.d:232
          89792	            244	dmd.declaration.VarDeclaration dmd.parse.Parser!(ASTCodegen, Lexer).Parser.parseAutoDeclarations src/dmd/parse.d:1098
          88688	            241	dmd.dtemplate.TemplateInstance dmd.parse.Parser!(ASTCodegen, Lexer).Parser.parsePrimaryExp src/dmd/parse.d:7931
          85824	            894	dmd.expression.DotIdExp dmd.parse.Parser!(ASTCodegen, Lexer).Parser.parsePostExp src/dmd/parse.d:8812
          70912	            277	dmd.declaration.AliasDeclaration dmd.dtemplate.TemplateTypeParameter.declareParameter src/dmd/dtemplate.d:5403
          65856	           1372	dmd.root.array.Array!(dmd.dsymbol.Dsymbol).Array dmd.parse.Parser!(ASTCodegen, Lexer).Parser.parseDeclDefs src/dmd/parse.d:310
          64224	            669	dmd.expression.CallExp dmd.root.rmem.allocClass src/dmd/root/rmem.d:232
from profilegc.log for dmd - this is why you ideally want the full call stack: this is just a bunch of random stuff.