Action and Heatmap with the same query give different results
Bug description
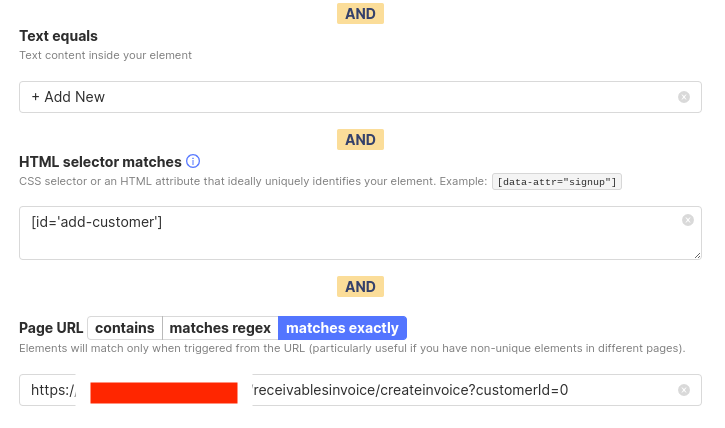
In this thread in the community slack it is reported that an action that exactly matches the toolbar's heatmap query doesn't match.
They're often the same scale ( i.e. 3 clicks vs 5 clicks, or 250 clicks vs 300 clicks. Action is always higher than heatmap.)
Action definition

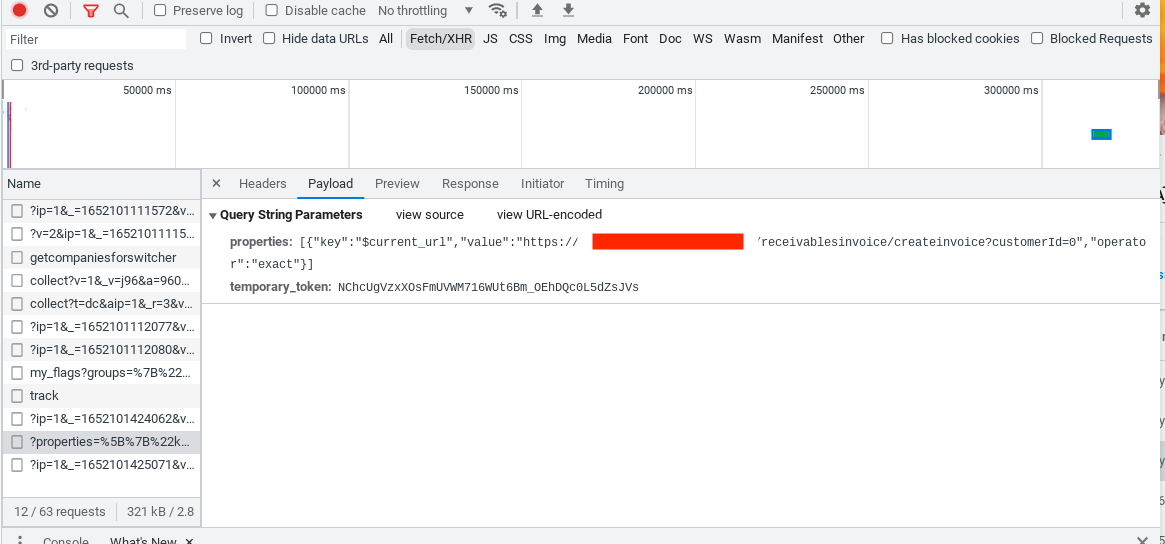
Heatmap query

How to reproduce
Environment
- [ ] PostHog Cloud
- [ ] self-hosted PostHog (ClickHouse-based), version/commit: please provide
- [ ] self-hosted PostHog (Postgres-based, legacy), version/commit: please provide
Additional context
Thank you for your bug report – we love squashing them!
@pauldambra can be closed?
It's a report from a self-hosted customer so I'd like to leave it open until we confirm that #9827 did or didn't help in 1.36.0
(we're not expecting it to completely resolve the issue but 🤞
we're not expecting it to completely resolve the issue
Why is that? 🤔
I think one resolution might be via documentation...
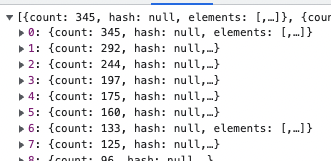
E.g. in this test case there isn't an API response with a count of 558


presumably multiple things from the API are matching against that HTML element and it needs to be clearer to the user why the numbers might differ
@neilkakkar the customer reports in Slack
When I look at 90 days, I'm seeing 4,198 total sum on the trend map vs 3,846 on the heatmap. We're averaging 46 clicks a day, so doubtful that a few hours accounts for the hundreds of click discrepancy.
(sharing numbers here since the customer isn't identified :))
This issue hasn't seen activity in two years! If you want to keep it open, post a comment or remove the stale label – otherwise this will be closed in two weeks.
This issue was closed due to lack of activity. Feel free to reopen if it's still relevant.