pykafka
 pykafka copied to clipboard
Memory grows unbounded for producer
PyKafka version: 2.8.0 ebbc5c7 Kafka version: 0.8.2 rdkafka version: 0.11.6
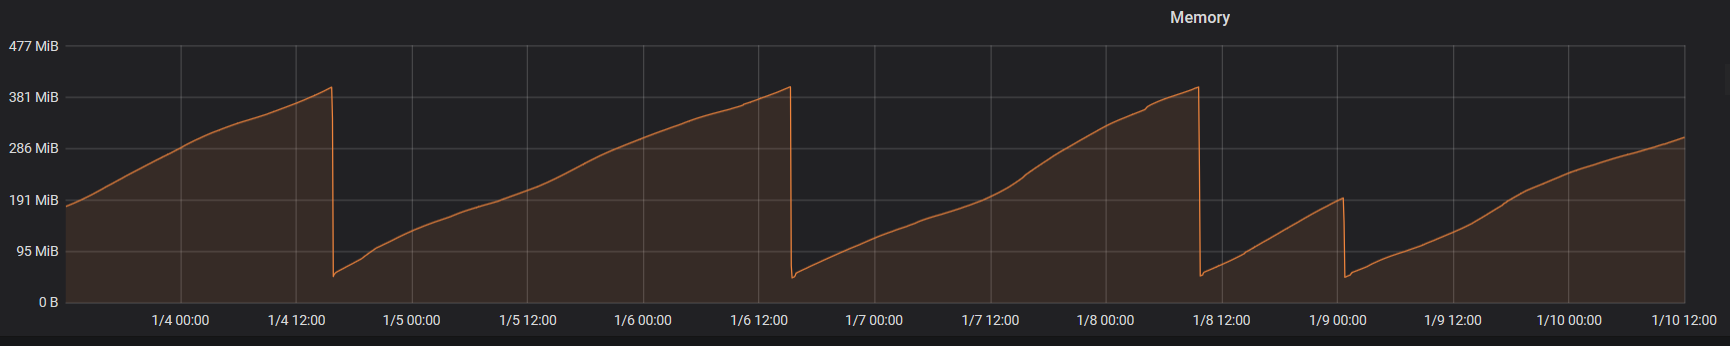
I have this issue where memory grows unbounded in my container application, and the issue seems specifically tied to pykafka as I was on kafka-python previously without this issue. I have set a memory limit for the container to 400 MB, at which point the orchestrator kills the application. The real issue that I want to resolve though is to just keep the memory utilization relatively constant. I do not have delivery reports enabled and I use rdkafka. It appears to be an issue for the producer part, and not so much the consumer part because I have services that use a producer(where memory usage keeps growing), services that use a consumer(has a constant memory usage) and services that use both(where memory usage also keeps growing).
I have read about similar issues like this in rdkafka / pykafka, where it is specified that if you have delivery reports enabled (which I don't) and you don't call get_delivery_report you will see memory usage grow unbounded like it is specified in the documentation. But since I don't have that enabled, I don't know if that is causing the issue.
See picture below.
Thanks @LasseGravesen. Can you provide any example code that might be used to replicate the memory growth issue you're seeing? Without it, it's hard to know what might be causing the problem.
See here: https://github.com/LasseGravesen/Kafka-Test
When I started running the containers, the producer container was at 22 MB. After running for roughly 25 minutes, that had increased to 32 MB. It's a slow process, but it keeps increasing. After 40 minutes, it's up to 36 MB.
Let me know if you can't get it up and running on your end. You can probably lower the amount of characters in the message to something less, I don't think it's necessary to have 10 000 characters for the effect to be apparent as it happens in production with messages of size 1 KB. @emmett9001
@emmett9001 I tried disabling rdkafka, and with that configuration it seems to hit a memory ceiling after a while and stays there. I think the issue might be related to rdkafka somehow, but I couldn't tell you why.
I ran tracemalloc and this is the result:
/home/user/Envs/kafkastuff/lib/python3.6/site-packages/pykafka/rdkafka/producer.py:78: size=61.8 MiB, count=1907312, average=34 B main.py:46: size=1197 KiB, count=9044, average=136 B /home/user/Envs/kafkastuff/lib/python3.6/site-packages/pykafka/producer.py:394: size=1060 KiB, count=9045, average=120 B /home/user/Envs/kafkastuff/lib/python3.6/site-packages/pykafka/connection.py:143: size=1024 KiB, count=3, average=341 KiB
Seemingly the issue is this line:
https://github.com/Parsely/pykafka/blob/master/pykafka/rdkafka/producer.py#L78
I don't know if I'm doing anything wrong as the problem is easily reproduceable as I did in the repo I linked, but I think that this would have been an obvious issue for anyone that uses Kafka for large volumes of messages. I'm seeing this problem in a context where I use Kafka for ranging from a hundreds of thousands of messages, to tens of millions of messages.
Yup, from what I can tell this looks like a real and nontrivial issue. I'm not sure if a similar ticket exists on librdkafka's issue tracker, but it looks like the problem is either in librdkafka itself or (more likely IMO) in pykafka's librdkafka interface code.
It's also worth noting that Parsely (the company I work for as the maintainer of pykafka) does not use pykafka's librdkafka functionality in production, so my ability to test it at scale is limited.
I don't think the problem itself is pykafka, as it works as intended if I disable the rdkafka integration. I might have to open a ticket with them. Though there might be a problem with how pykafka is implementing the rdkafka integration.
There is some pykafka python code that only runs when rdkafka is being used, so afaik we can't categorically rule out that it's causing the issue.
I think the issue is to do with reports not getting collected correctly, even though you can set the option to False I think rdkafka still needs it to be collected, but it looks like it already has a callback in the C driver that should collect them. I changed my implementation a little bit and I saw this behaviour with a fairly large message batch.
pykafka, rdkafka disabled, delivery reporting disabled, 15 second runtime @ max 1.74% memory utilization:
pykafka, rdkafka disabled, delivery reporting enabled, with calls to get_delivery_report, 15 second runtime @ max 7.03% memory utilization:
{"message": "memory-usage", "memory-usage-in-%": "2.08", "timestamp": "2019-01-16T19:19:53.566798"}
{"message": "memory-usage", "memory-usage-in-%": "2.35", "timestamp": "2019-01-16T19:19:54.668717"}
{"message": "memory-usage", "memory-usage-in-%": "2.79", "timestamp": "2019-01-16T19:19:55.755400"}
...
{"message": "memory-usage", "memory-usage-in-%": "6.42", "timestamp": "2019-01-16T19:20:06.559789"}
{"message": "memory-usage", "memory-usage-in-%": "6.73", "timestamp": "2019-01-16T19:20:07.755320"}
{"message": "memory-usage", "memory-usage-in-%": "7.03", "timestamp": "2019-01-16T19:20:08.751840"}
pykafka, rdkafka enabled, delivery reporting disabled, 43 second runtime @ max 8.23% memory utilization:
{"message": "memory-usage", "memory-usage-in-%": "2.06", "timestamp": "2019-01-16T19:23:05.740537"}
{"message": "memory-usage", "memory-usage-in-%": "2.33", "timestamp": "2019-01-16T19:23:06.527242"}
{"message": "memory-usage", "memory-usage-in-%": "2.56", "timestamp": "2019-01-16T19:23:07.316292"}
...
{"message": "memory-usage", "memory-usage-in-%": "8.12", "timestamp": "2019-01-16T19:23:47.017051"}
{"message": "memory-usage", "memory-usage-in-%": "8.16", "timestamp": "2019-01-16T19:23:47.671626"}
{"message": "memory-usage", "memory-usage-in-%": "8.23", "timestamp": "2019-01-16T19:23:48.458537"}
pykafka, rdkafka enabled, delivery reporting enabled, 19 second runtime @ max 10.36% memory utilization:
{"message": "memory-usage", "memory-usage-in-%": "1.93", "timestamp": "2019-01-16T19:25:49.310730"}
{"message": "memory-usage", "memory-usage-in-%": "2.38", "timestamp": "2019-01-16T19:25:50.523944"}
{"message": "memory-usage", "memory-usage-in-%": "2.88", "timestamp": "2019-01-16T19:25:51.480503"}
...
{"message": "memory-usage", "memory-usage-in-%": "8.76", "timestamp": "2019-01-16T19:26:06.828358"}
{"message": "memory-usage", "memory-usage-in-%": "9.10", "timestamp": "2019-01-16T19:26:07.657954"}
{"message": "memory-usage", "memory-usage-in-%": "10.36", "timestamp": "2019-01-16T19:26:08.706014"}
Where really the only one with "good" behaviour is the pykafka one with no rdkafka and no delivery reporting.
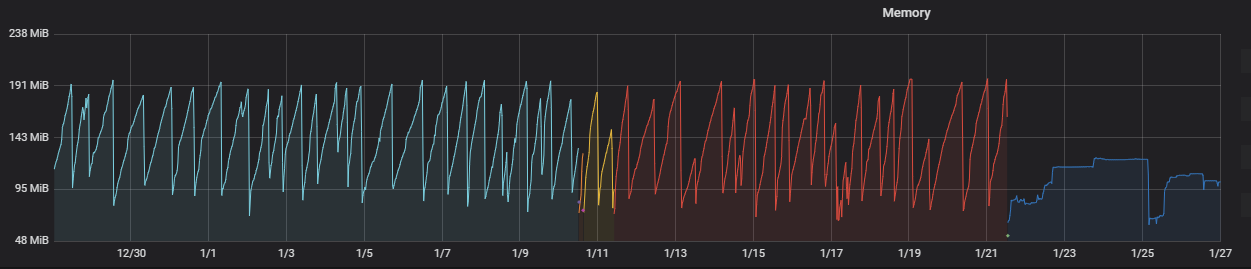
I think the problem is with the pykafka-rdkafka integration, I've replaced pykafka with confluent-kafka for my producers and it appears to not have an issue with leaking memory over time. See this, where the darker blue on the right is confluent-kafka and the others are pykafka.
@emmett9001