FastANI
 FastANI copied to clipboard
Share workflow for visualizing FastANI results
Hi,
This is not an issue report, but I would like to share my workflow for visualizing FastANI results as I think it will be useful for other users.
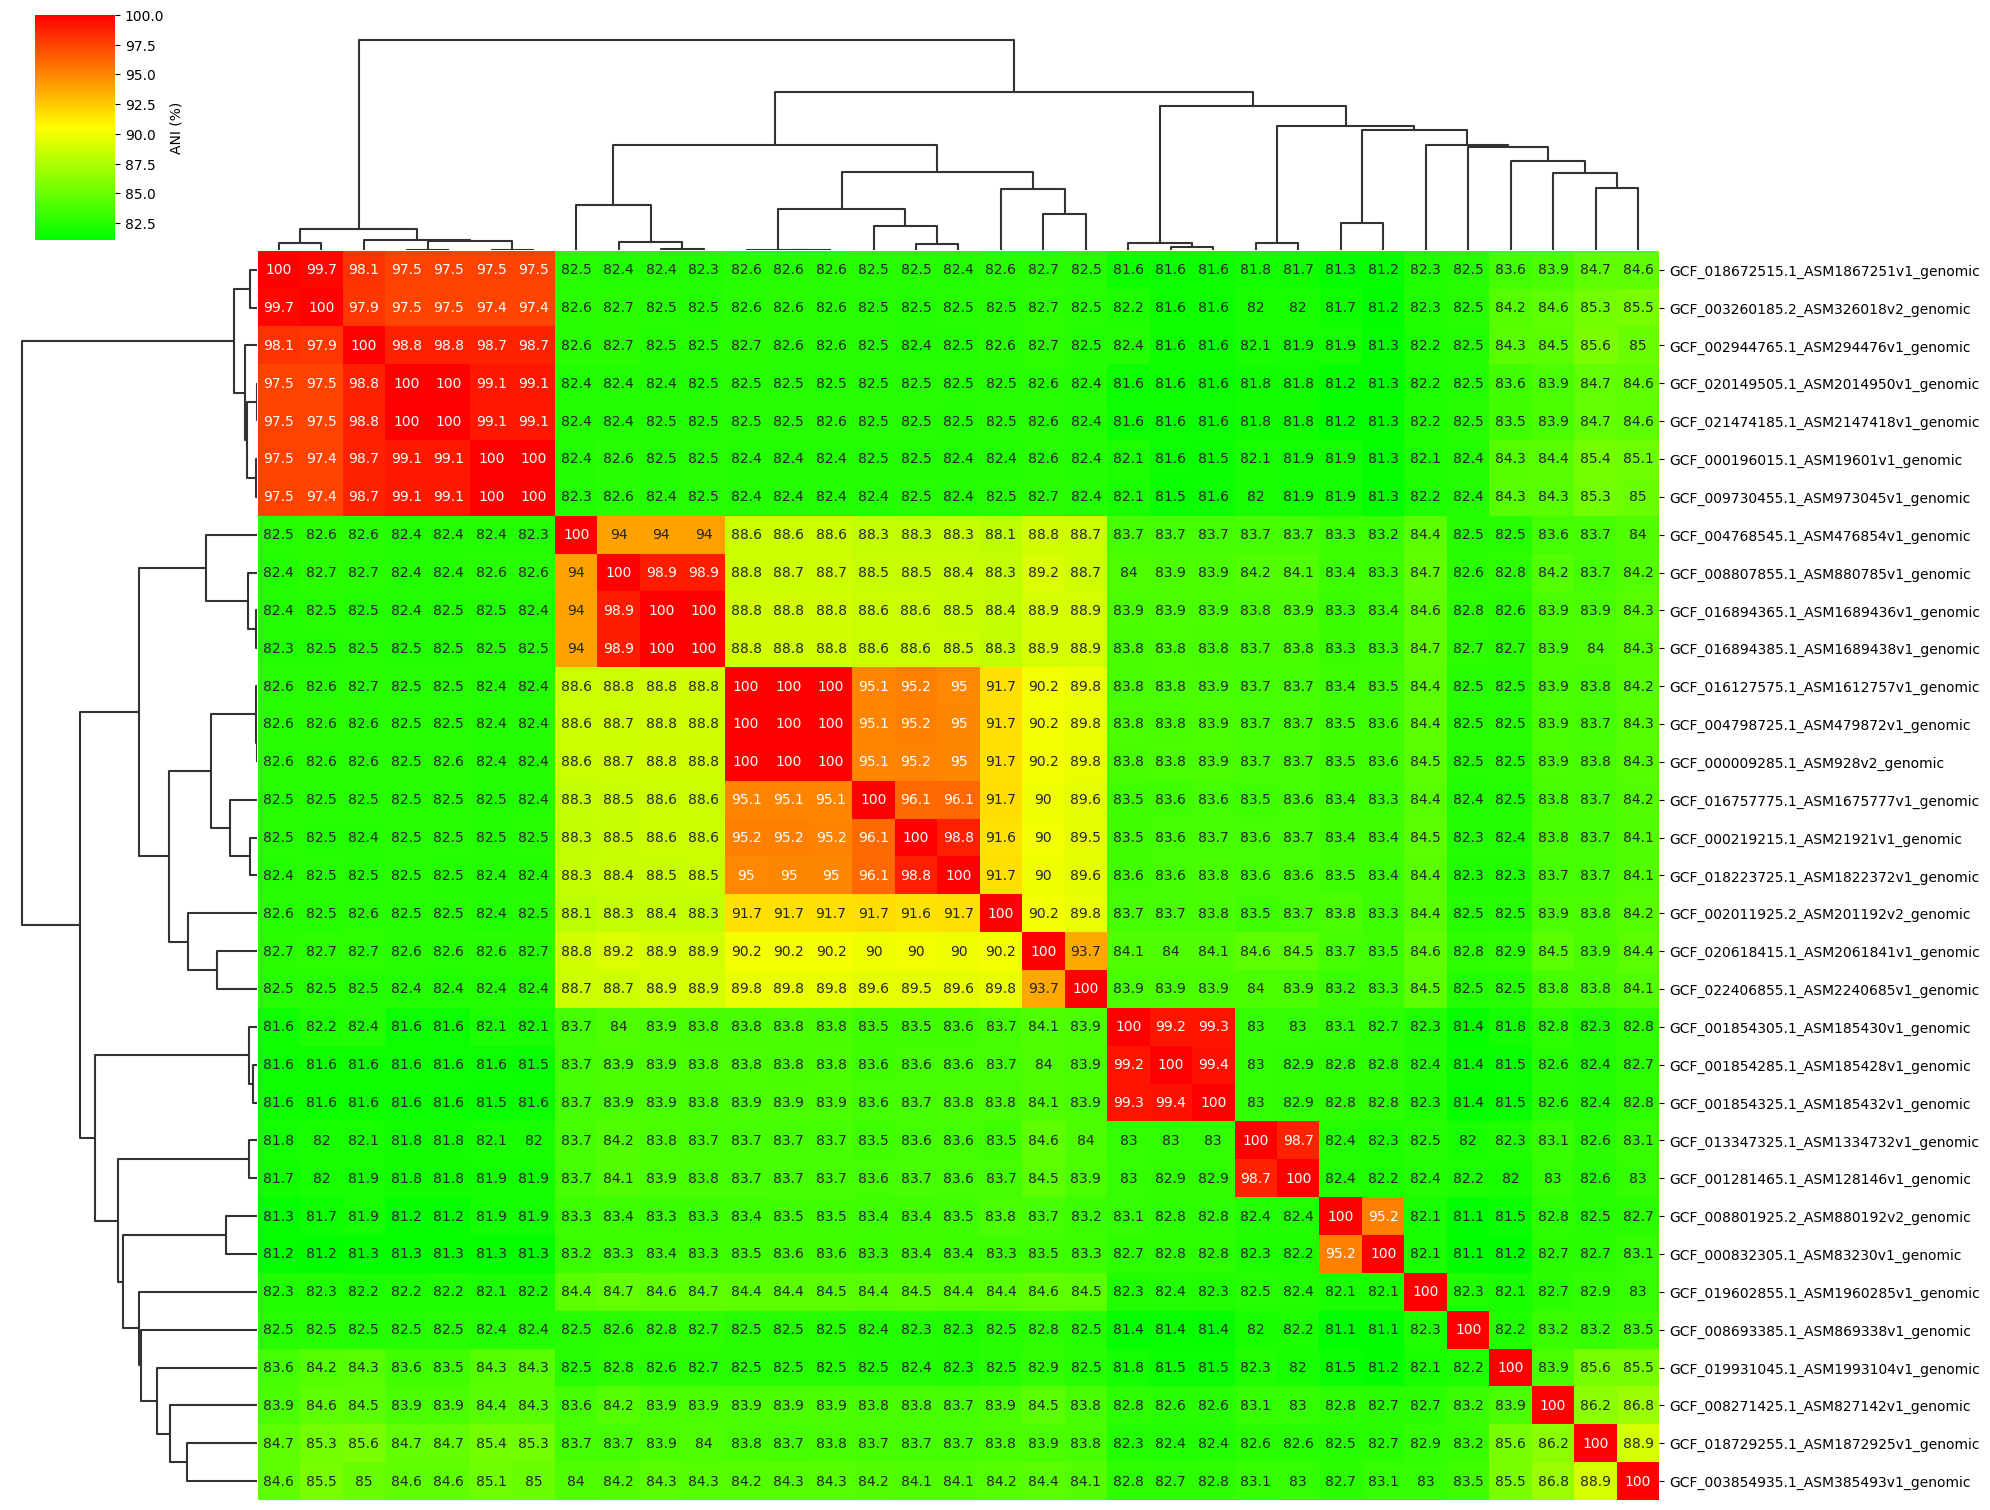
1. Visualize all-vs-all ANI matrix
I developed a Python tool ANIclustermap for visualization of ANI calculation results using FastANI, which can automatically perform the workflow from ANI calculation among all-vs-all genomes to clustering and visualization of ANI matrix. It can output the following figure, clustered ANI matrix, newick format dendrogram.
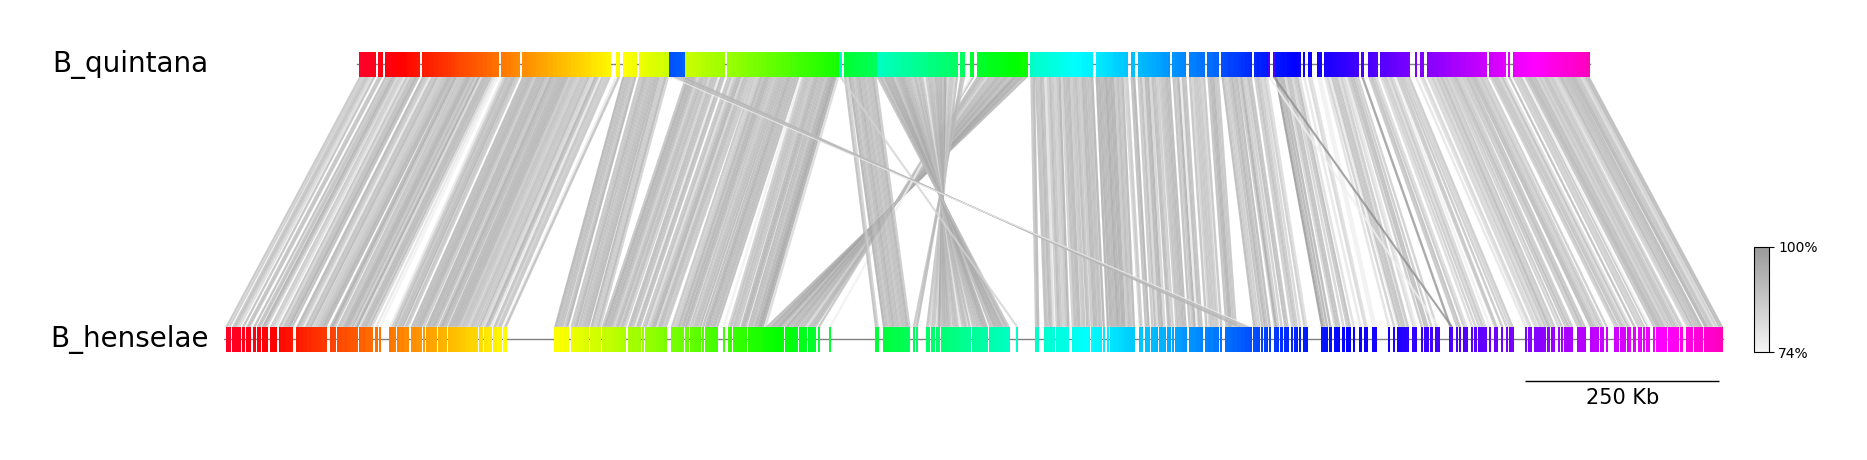
2. Visualize Conserved Regions b/w Two Genomes
A visualization R script using genoPlotR is already provided, but I thought it would be nice to have one for Python users, so I created a Python script (visualize.py) that can plot the following figure. See repository for details of the script.
Example 1.
colormap=hsv, link_color=grey, curve=False (Default)
python visualize.py B_quintana.fna B_henselae.fna fastani.out.visual example01.png
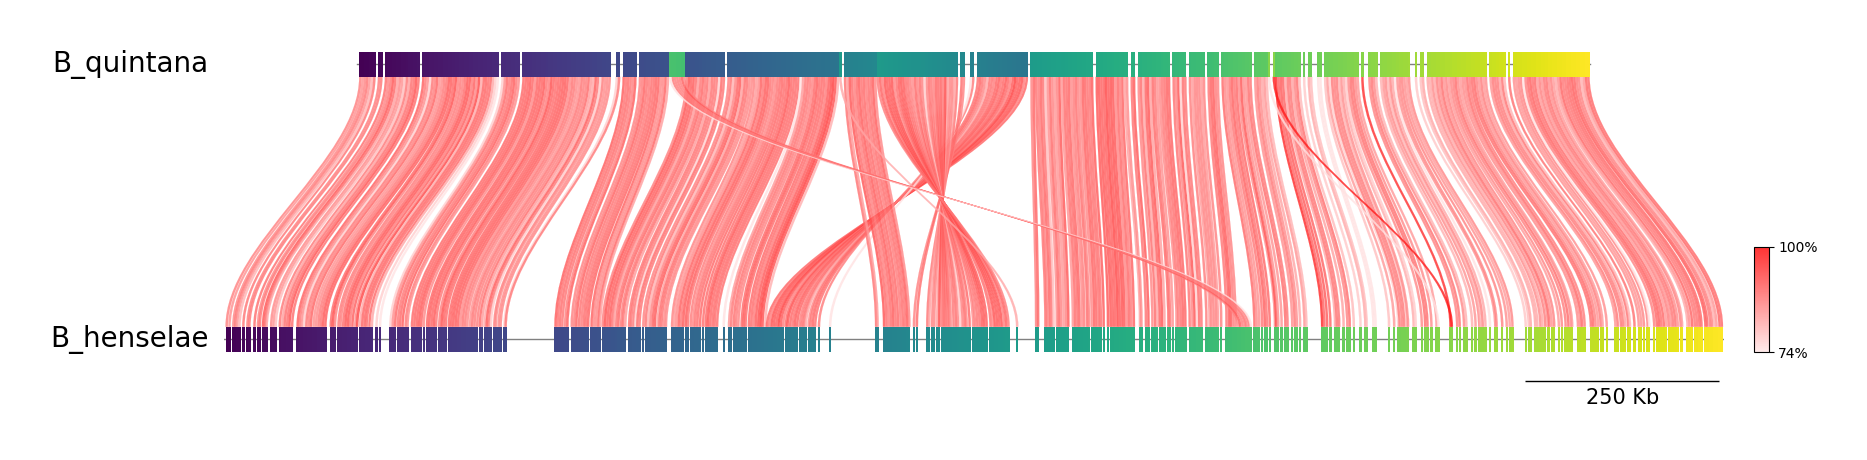
Example 2.
colormap=viridis, link_color=red, curve=True
python visualize.py B_quintana.fna B_henselae.fna fastani.out.visual example02.png --cmap viridis --link_color red --curve
Hope this information helps other users.
Thanks.
Thanks a lot for making this code! I am trying it out with one of my samples but I get the following error:
Traceback (most recent call last):
  File "/gpfs/data/fs71579/lucaz/_TOOLs/visualize.py", line 127, in <module>
    main()
  File "/gpfs/data/fs71579/lucaz/_TOOLs/visualize.py", line 35, in main
    start1, end1 = int(row[6]), int(row[7])
IndexError: list index out of range
Any idea what was wrong?
I think that error occurs when the *.visual file contains blank lines.
I modified visualize.py to ignore the blank lines. Please try again with the modified code.
If it still doesn't seem to work, please upload your *.visual file and it will help me solve the problem.
Guess the issue is still there as now I got:
Traceback (most recent call last):
  File "/gpfs/data/fs71579/lucaz/_TOOLs/visualize.py", line 130, in <module>
    main()
  File "/gpfs/data/fs71579/lucaz/_TOOLs/visualize.py", line 38, in main
    start1, end1 = int(row[6]), int(row[7])
IndexError: list index out of range
I have uploaded my *.visual file zipped fastani_test.out.zip
Thanks a lot for the prompt support!!
I could not reproduce the error in my environment (Ubuntu 20.04, Python 3.8.10). Since I cannot reproduce the error, it seems difficult for me to offer a solution. My apologies.
The visualization output result in my environment looks like this.

How did you get the plot with just the '.visual' file?
Maybe I am prompting the command wrongly?
python _TOOLs/visualize.py _input/genome_1.fa _input/genome_2.fa FastANI_test.out FastANI_test.png
Ah, now I know what caused the error. You have the wrong file set for the third argument.
Set FastANI_test.out.visual instead of FastANI_test.out as follows.
python _TOOLs/visualize.py _input/genome_1.fa _input/genome_2.fa FastANI_test.out.visual FastANI_test.png
:warning: Also, please be careful, visualize.py is designed to do comparative plots of prokaryotic genomes that are about less than 10Mb size. Keep in mind that plotting a genome as large as a eukaryotic genome will consume a lot of memory and drawing time. In my environment, plotting your data took about 4GB of memory and 8 minutes of drawing time.
🙈 what a dumb error...sorry and thanks for answering! I am aware of the size but still it's a nice way to visualize rearrangements between 2 assemblies. However now I got a different error:
Traceback (most recent call last):
  File "/gpfs/data/fs71579/lucaz/_TOOLs/visualize.py", line 130, in <module>
    main()
  File "/gpfs/data/fs71579/lucaz/_TOOLs/visualize.py", line 64, in main
    track1.add_feature(link1[1], link1[2], plotstyle="bigbox", facecolor=color)
  File "/gpfs/data/fs71579/lucaz/miniconda3/envs/R/lib/python3.10/site-packages/pygenomeviz/track.py", line 241, in add_feature
    raise ValueError(err_msg)
ValueError: start-end must be '0 <= start <= end <= 4314075' (start=78088642, end=78091641)
If I run the plotting function in R from the fastANI repository (FastANI/scripts/visualize.R) it works, so it shouldn't be a problem with the '.visual' file. How can I make the plot without specifying the 2 fasta files? As you manage to generate the plot just from the '.visual' file.
Probably your input FASTA file is multi-record, right? Since visualize.py was created assuming a single record FASTA file (complete genome) as input, it was not able to correctly obtain total sequence length from the multi-record FASTA file. This is why I think you are getting an error in your data.
I have modified visualize.py to work with multi-record FASTA files, so please try again with the modified program.
It works now, thanks for the fast fixing! Yes, the fasta files are multi-record but because they are from Eukaryotes so each sequence represent a different chromosome. The regions of the reference genome are plotted following the coordinates in the visual file (9th and 10th columns) or following the in order of the sequences in the multi-record fasta file?
The regions of the reference genome are plotted following the coordinates in the visual file (9th and 10th columns) ?
Yes. The visual file has the conserved region coordinates of the first argument genome in the 7th and 8th columns, and the conserved regions of the second argument genome in the 9th and 10th columns. The row data in the Visual file is sorted in ascending order in 9th and 10th columns, so that the genome of the second argument is plotted as the reference genome.
or following the in order of the sequences in the multi-record fasta file ?
Yes. In FastANI, when a multi-record fasta file is input as the genome sequence, each sequence concatenated in order is used for genome comparison.
Hi, Thanks for these script! Is it possible to output the clustered genomes as a table? For example:
genome cluster genome1 1 genome2 1 genome3 2 genome4 3
From the clustering ANI matrix (ANIclustermap_matrix.tsv) generated by ANIclustermap, it is possible to create a table like the one you show in your example.
Example code
Below is an example code (animatrix_to_cluster_table.py) to create the cluster table from ANIclustermap_matrix.tsv.
import sys
import pandas as pd

# Get argument
args = sys.argv
matrix_tsv_file = args[1]  # ANIclustermap_matrix.tsv
cluster_ani_thr = float(args[2])  # e.g. 95.0
cluster_tsv_file = args[3]  # Output cluster table file

# Parse cluster ANI matrix
df = pd.read_table(matrix_tsv_file)
cluster_id = 1
cluster_base_idx = 0
cluster_size_record = 1
genome_name2cluster_id = {}
for i, genome_name in enumerate(df.columns):
    cluster_candidate_df = df.iloc[cluster_base_idx : i + 1, cluster_base_idx : i + 1]
    ani_thr_match_count = (cluster_candidate_df > cluster_ani_thr).sum().sum()
    if ani_thr_match_count != cluster_size_record**2:
        cluster_id += 1
        cluster_base_idx = i
        cluster_size_record = 1

    genome_name2cluster_id[genome_name] = cluster_id
    cluster_size_record += 1

# Output cluster table
cluster_table_dict = {
    "genome": genome_name2cluster_id.keys(),
    "cluster_id": genome_name2cluster_id.values(),
}
cluster_table_df = pd.DataFrame(cluster_table_dict)
cluster_table_df.to_csv(cluster_tsv_file, sep="\t", index=False)
Example Command
You can create a cluster table by the following command. Use example dataset here. ANI threshold for cluster assignment can be set as the second argument.
python animatrix_to_cluster_table.py ANIclustermap_matrix.tsv 95 cluster_table.tsv
cluster_table.tsv
genome	cluster_id
GCF_003260185.2_ASM326018v2_genomic	1
GCF_018672515.1_ASM1867251v1_genomic	1
GCF_002944765.1_ASM294476v1_genomic	1
GCF_020149505.1_ASM2014950v1_genomic	1
GCF_021474185.1_ASM2147418v1_genomic	1
GCF_009730455.1_ASM973045v1_genomic	1
GCF_000196015.1_ASM19601v1_genomic	1
GCF_004768545.1_ASM476854v1_genomic	2
GCF_008807855.1_ASM880785v1_genomic	3
GCF_016894385.1_ASM1689438v1_genomic	3
GCF_016894365.1_ASM1689436v1_genomic	3
GCF_016127575.1_ASM1612757v1_genomic	4
GCF_004798725.1_ASM479872v1_genomic	4
GCF_000009285.1_ASM928v2_genomic	4
GCF_016757775.1_ASM1675777v1_genomic	4
GCF_018223725.1_ASM1822372v1_genomic	5
GCF_000219215.1_ASM21921v1_genomic	5
GCF_002011925.2_ASM201192v2_genomic	6
GCF_020618415.1_ASM2061841v1_genomic	7
GCF_022406855.1_ASM2240685v1_genomic	8
GCF_001854305.1_ASM185430v1_genomic	9
GCF_001854325.1_ASM185432v1_genomic	9
GCF_001854285.1_ASM185428v1_genomic	9
GCF_013347325.1_ASM1334732v1_genomic	10
GCF_001281465.1_ASM128146v1_genomic	10
GCF_008801925.2_ASM880192v2_genomic	11
GCF_000832305.1_ASM83230v1_genomic	11
GCF_019602855.1_ASM1960285v1_genomic	12
GCF_008693385.1_ASM869338v1_genomic	13
GCF_019931045.1_ASM1993104v1_genomic	14
GCF_008271425.1_ASM827142v1_genomic	15
GCF_003854935.1_ASM385493v1_genomic	16
GCF_018729255.1_ASM1872925v1_genomic	17
Hi again, Is it possible to just plot the heatmap again, without running ANI from start? I am working with about 200 genomes with --annotation on - apparently I need to adjust the picture size.
Hi, @shlomobl
Is it possible to just plot the heatmap again, without running ANI from start?
Yes.
If you re-run the command by changing only the appearance options of the figure, such as --annotation, ANIclustermap should re-plot using the results of the previous ANI calculation.
ANIclustermap will output the following message if it reuses the results of a previous ANI calculation.
# Step1: Previous fastANI matrix result found. skip fastANI run.