Possible considerations as you rewrite stage 2 (as discussed in issue #348)
When @MattHJensen, @Peter-Metz, and I were investigating creating state-specific PUFs, we noted that some of the values we were targeting have substantially different national totals reported in our source of targets, SOI Historical Table 2, than the national totals we calculated from the PUF. We did not have time to investigate this as thoroughly as we liked.
Now that I am learning how to use taxdata, I am in a better position to dig in deeper and have reason to do so for an upcoming project.
Because #348 is specific to Julia I am opening a separate issue with thoughts on considerations that are not specific to Julia. They are of possible interest to @chusloj and @andersonfrailey.
I don't think my comments below - if you think they are worth addressing - could be addressed in your immediate task of rewriting in Julia. However, if you want to address them later, you might want to put a structure in place now that makes that easier later.
I have 3 main comments here:
- I believe it would make sense to add more distributional and non-distributional targets to stage 2 targeting.
- I believe the task of constructing targets could be made easier by using more-recent historical data.
- Technical choices you make now could make addressing these 2 items later easier.
I begin by describing my current understanding of targeting, because if I misunderstand that, then some of my other comments below may be moot. After that I discuss potential value from adding more targets, and finally a few considerations relevant to the rewrite.
Targeting process As I understand the taxdata documentation - and I am not 100% sure of this and would appreciate any corrections, if @andersonfrailey can take a look - here's how I think the targeting generally works:
- Annual targets for growth rates of total returns come from the variable RETS in CBO_baseline.csv, which according to the updating instructions, comes from the IRS's total return projections in Table 1B of Publication 6187, with extrapolation as needed to fill the gap between the end of the IRS projection period and the end of the taxdata projection period.
- Annual targets for 28 (I think) specific items, including total returns by filing status, total values for certain AGI-component income variables, and for wages by AGI bin get (a) historical values largely from IRS Publication 1304 and associated spreadsheet files, and (b) forecast values from economic driver variables. I base this on my reading of Stage2_Base_Year_Sources.csv. However, as I look at SOI_estimates.csv, it seems like historical values are used only through 2014, and the forecast begins after that, although I am not certain of this.
- Then there is stage 3 adjustment of the interest income distribution, which might better be folded into stage 2.
Improving distributional targeting The following table compares the number of returns by AGI range in 2017, the latest year of data, for:
- IRS Publication 1304 (Table 1.1)
- IRS Historical Table 2
- puf advanced to 2017, where (a) I used the latest version of taxdata (downloaded 2 days ago) to create puf.csv, then (b) used tax-calculator 2.9 to advance the puf to 2017, and (c) filtered the result to include only records that are based primarily on the original puf (data_source == 1)
The AGI ranges are the Historical Table 2 ranges. Suffixes soi, ht2, and puf identify the 3 different sources, respectively. The columns that begin with "d" give the difference between the advanced puf and either soi or ht2, and those that start with "p" give the percentage difference (with puf or ht2 as the denominator).
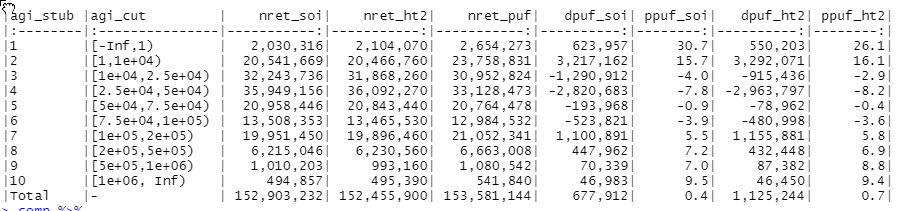
While the advanced puf is very close to soi and ht2 on the bottom line, it is quite far from those sources in different income ranges. (ht2 is far from soi in a few ranges, which is a matter for separate investigation that is important to creation of state-specific pufs but not relevant here; I assume soi is the standard against which we really want to compare). While the largest percentage differences are in the first two AGI ranges, the differences that will have the largest impact on tax calculations are in the $100k+ income ranges. I have not had time to examine total AGI and tax liability across the files but I presume they will be higher than the actual data in these income ranges, too. If so, and if carried forward to future years, then presumably we would overestimate impacts of reforms on higher-income ranges and underestimate impacts in some of the immediately lower income ranges.
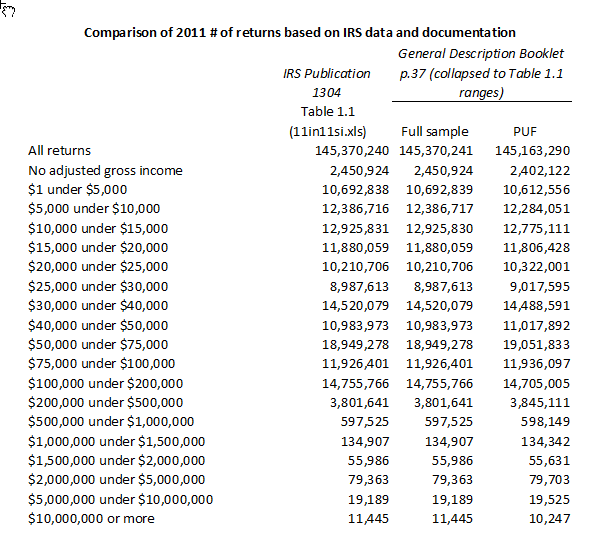
I wondered if these differences could be attributable to definitional or classification differences between what is in the puf and what is included in Publication 1304. If so, that might alter conclusions. However, my preliminary conclusion is no, subject to any correction from people more familiar with taxdata than me. The table below compares number of returns by income range in IRS Publication 1304 Table 1.1 in 2011, the same publication used for future targets, by the income ranges in that publication, with the number of returns in the PUF sample and the full sample as reported by SOI on p. 37 of:
Bryant, Victoria L. “General Description Booklet for the 2011 Public Use Tax File.” Individual Statistics Branch, Statistics of Income Division, Internal Revenue Service, August 2016.
The table shows that in 2011 the distribution of income in our source data matches the distribution in our source of targets quite closely. This would seem to rule out definitional or classification differences being the cause of the difference in the 2017 distribution, leading me to believe the differences result from the targeting process.
Targeting more variables I think there are two issues here - again, subject to correction.
First, as I understand the targeting process, our use of real SOI data stops in 2014 even though we have data through 2017 (and in a few weeks Publication 1304 data will be available for 2018).
Second, although we target wages by income range, we don't target other items by range and furthermore, as I understand the wage targeting, the bins are "frozen" and total wages in each bin grow at the same rate. This is not what we would expect in general, I think. Setting aside questions of how the distribution of real income changes over time, even if that stays constant, when you have wages driven upward annually due to inflation and productivity gains, people get pushed upward over time, spilling over from the top of one income bin and falling into the bottom of the next, bringing wages along with them (and potentially dragging down average wages in some of the bins even as they increase the number of people in those bins). Thus, it might be possible to improve your distribution of wages by targeting not just total wages in each bin but also the number of wage earners. But before worrying too much about that, I think it would be important to simply target the number of returns by income range, which obviously is highly correlated with the number of wage earners.
I think targeting the number of returns by AGI range should give much better distributional results, and ultimately much more realistic tax-calculation results.
Adding variables and ranges to your list of targets is no good unless you can construct reasonable estimates of values to target. One big advantage of updating history from 2014 to 2017 (and 2018 in a matter of weeks) is that you'll have good targets for a very recent year. That should limit the extent to which the extrapolated data walk away from realistic numbers in later years as you extend the forecast. So if you could incorporate detailed distributional data for targeting through the latest historical year, that should go a long way toward improving results, and should make the largest mismatches in the first table above, which is an historical year, go away.
For forecast years, in the near term you could simplify, using fewer targets. Over the longer term it might make sense to develop econometric methods for forecasting the distribution of returns and a few other variables, given an underlying macroeconomic forecast.
Implications for rewriting stage 2 I realize the things I mention above go far beyond rewriting stage 2 in Julia. However, there are things you could do now that would ease that later, should you think the comments above are worth addressing.
- Distributional targeting would result in substantially larger problems, although they would be quite sparse or else separable. Taking advantage of sparsity can make the problem easier to solve.
- As mentioned in a comment in #348, you may want to have a nonlinear penalty function rather than the current one, in which case you need a solver that can solve a nonlinear program.
- Solutions will be much faster and easier if you provide analytic derivatives, which should be relatively straightforward for most objective functions you might consider.
Thus, picking the right solver is important. In my experience, IPOPT compiled with HSL linear solvers can handle problems as large as this without any trouble and I'd recommend exploring it, although other solvers might be able to do what you want. You'd need to get an academic license for the open-source HSL solvers. All of this can be done in Julia, I believe either in Ipopt.jl or through JuMP.jl (I am not a Julia expert and have not tried either out for this purpose).
Being able to code derivative functions would also be important, although might not have to be done at the start - but worth thinking ahead about how to incorporate that.
Finally, it would make sense to develop quality-evaluation methods to help decide the extent to which adding targets improves results.
Sorry for the long note but I think working to improve the distribution of income and other variables would add a lot of value to taxdata and yield more realistic and supportable results.