PhpSpreadsheet
 PhpSpreadsheet copied to clipboard
DataSeriesValues: How to provide hardcoded values
This is:
- [x] a bug report
- [x] a feature request
- [ ] **not** a usage question (ask them on https://stackoverflow.com/questions/tagged/phpspreadsheet or https://gitter.im/PHPOffice/PhpSpreadsheet)
What is the expected behavior?
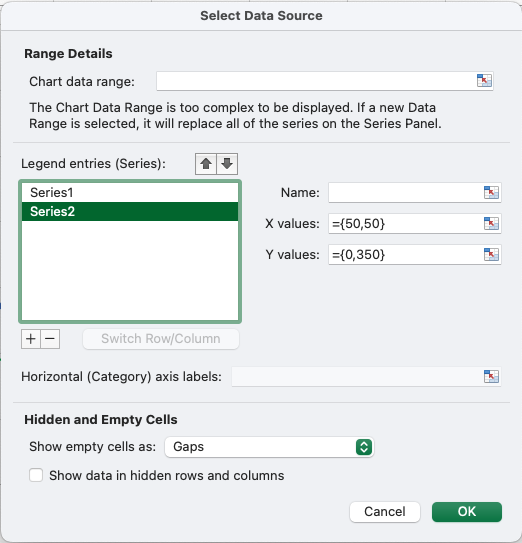
Assigning the parameter $dataSource for a DataSeriesValues to hardcode values '{0,350}'
It can be done directly in Excel ...
Add display on the scatterPlot as a vertical line ...

What is the current behavior?
Receive the error "Cell coordinate string can not be a range of cells"
What are the steps to reproduce?
Please provide a Minimal, Complete, and Verifiable example of code that exhibits the issue without relying on an external Excel file or a web server:
<?php

require __DIR__ . '/vendor/autoload.php';

// Create new Spreadsheet object
$spreadsheet = new \PhpOffice\PhpSpreadsheet\Spreadsheet();

// add code that show the issue here...
        $dataSeriesLabels = [
            new DataSeriesValues(DataSeriesValues::DATASERIES_TYPE_STRING,   '"X&Y"', null, 1),
            new DataSeriesValues(DataSeriesValues::DATASERIES_TYPE_STRING,   '"Vertical Line"', null, 1),
        ];

        $dataSeriesValues = [
            new DataSeriesValues(DataSeriesValues::DATASERIES_TYPE_NUMBER,  $yValueRange, '#,##0', $dataCnt, null, 'circle', null, 5),
            new DataSeriesValues(DataSeriesValues::DATASERIES_TYPE_NUMBER,  '{0,350}', '#,##0', 2, null, 'circle', null, 5),
        ];

        $xAxisTickValues = [
            new DataSeriesValues(DataSeriesValues::DATASERIES_TYPE_NUMBER, $xValueRange, '#,##0', $dataCnt),
            new DataSeriesValues(DataSeriesValues::DATASERIES_TYPE_NUMBER, '{50,50}', '#,##0', 2),
        ];
If this is an issue with reading a specific spreadsheet file, then it may be appropriate to provide a sample file that demonstrates the problem; but please keep it as small as possible, and sanitize any confidential information before uploading.
What features do you think are causing the issue
- [ ] Reader
- [ ] Writer
- [ ] Styles
- [ ] Data Validations
- [ ] Formula Calculations
- [x] Charts
- [ ] AutoFilter
- [ ] Form Elements
Does an issue affect all spreadsheet file formats? If not, which formats are affected?
Testing only in Xlsx
Which versions of PhpSpreadsheet and PHP are affected?
PhpSpreadsheet 1.28.0 PHP 8.1.3
It looks like the DataSeriesValues Constructor has parameters for $dataSource, which you would assign to null, and $dataValues, to which you would assign your array of values.
@oleibman I hate when I miss things like that. No more questions from me for the next 10 hours.
I am so happy that I am abler to reproduce the chart that I built in Excel directly. Thanks for the hints along the way.

I really wish that we had some documentation about building Charts; but it's difficult knowing how to structure something like that to make it easy to read, and even to know where to start
Might you be able to submit a PR with your final result as a new sample Charts/33whatever?
@oleibman yes, I would like to put something together and submit. It has been a while since I have done a PR.
There is a secondary chart (Line) in the spreadsheet that I am building. Is there an example of how to modify properties to the legend? I would like to give it a solid border.
Do I add information to the layout object?
        // Set the chart legend
        $layout = new Layout();
        $legend = new Legend(Legend::POSITION_TOP, $layout, false);
Hmm, I don't think there's currently a way to add a border to a Legend. I think Legend would need to extend Properties and then you could modify its line style. I'll consider adding that to PR #3434, or maybe a new PR.
Take a look at PR 3434. It's not quite what I suggested would be needed above; I hope it's a bit simpler. The code added there allows, among other things:
$legend->getBorderColor()->setColorProperties('ffc000');
I will try to merge it in a day or two, after which you will be able to merge with master and continue with your PR.
It looks like the DataSeriesValues Constructor has parameters for
$dataSource, which you would assign tonull, and$dataValues, to which you would assign your array of values.
I was just about to post a bug report about this.
I am attempting to do this and it is not working for me. Am I doing something wrong?
https://stackoverflow.com/questions/75607486/php-spreadsheet-charts-passing-data-values-instead-of-using-worksheet-data
@titansoftime I am not sure what your problem might be. Here's a slightly modified version of 33_Chart_create_line which uses some values from dataSource and some from dataValues, and it appears to work just fine for both.
$spreadsheet = new Spreadsheet();
$worksheet = $spreadsheet->getActiveSheet();
$worksheet->fromArray(
    [
        ['', 2010, 2011, 2012],
        ['Q1', 12, 15, 21],
        ['Q2', 56, 73, 86],
        ['Q3', 52, 61, 69],
        ['Q4', 30, 32, 0],
    ]
);

// Set the Labels for each data series we want to plot
//     Datatype
//     Cell reference for data
//     Format Code
//     Number of datapoints in series
//     Data values
//     Data Marker
$dataSeriesLabels = [
    new DataSeriesValues(
        DataSeriesValues::DATASERIES_TYPE_STRING, // dataType
        null, // 'Worksheet!$B$1', //dataSource
        null, // formatCode
        1, // pointCount
        [2010]), // dataValues
    new DataSeriesValues(
        DataSeriesValues::DATASERIES_TYPE_STRING,
        null, // 'Worksheet!$C$1',
        null,
        1,
        ['2011']), // 2011
    new DataSeriesValues(
        DataSeriesValues::DATASERIES_TYPE_STRING,
        null, // 'Worksheet!$D$1',
        null,
        1,
        [2012]), // 2012
];
$dataSeriesLabels[0]->setFillColor('FF0000');
// Set the X-Axis Labels
//     Datatype
//     Cell reference for data
//     Format Code
//     Number of datapoints in series
//     Data values
//     Data Marker
$xAxisTickValues = [
    new DataSeriesValues(
        DataSeriesValues::DATASERIES_TYPE_STRING,
        null, // 'Worksheet!$A$2:$A$5',
        null,
        4,
        ['q1', 'q2', 'q3', 'q4']), // Q1 to Q4
];
// Set the Data values for each data series we want to plot
//     Datatype
//     Cell reference for data
//     Format Code
//     Number of datapoints in series
//     Data values
//     Data Marker
$dataSeriesValues = [
    new DataSeriesValues(
        DataSeriesValues::DATASERIES_TYPE_NUMBER,
        null, //'Worksheet!$B$2:$B$5',
        null,
        4,
        [13, 57, 52, 31]),
    new DataSeriesValues(DataSeriesValues::DATASERIES_TYPE_NUMBER, 'Worksheet!$C$2:$C$5', null, 4),
    new DataSeriesValues(DataSeriesValues::DATASERIES_TYPE_NUMBER, 'Worksheet!$D$2:$D$5', null, 4),
];
$dataSeriesValues[2]->setLineWidth(60000 / Properties::POINTS_WIDTH_MULTIPLIER);

// Build the dataseries
$series = new DataSeries(
    DataSeries::TYPE_LINECHART, // plotType
    DataSeries::GROUPING_STACKED, // plotGrouping
    range(0, count($dataSeriesValues) - 1), // plotOrder
    $dataSeriesLabels, // plotLabel
    $xAxisTickValues, // plotCategory
    $dataSeriesValues        // plotValues
);

// Set the series in the plot area
$plotArea = new PlotArea(null, [$series]);
// Set the chart legend
$legend = new ChartLegend(ChartLegend::POSITION_TOPRIGHT, null, false);

$title = new Title('Test Stacked Line Chart');
$yAxisLabel = new Title('Value ($k)');

// Create the chart
$chart = new Chart(
    'chart1', // name
    $title, // title
    $legend, // legend
    $plotArea, // plotArea
    true, // plotVisibleOnly
    DataSeries::EMPTY_AS_GAP, // displayBlanksAs
    null, // xAxisLabel
    $yAxisLabel  // yAxisLabel
);

// Set the position where the chart should appear in the worksheet
$chart->setTopLeftPosition('A7');
$chart->setBottomRightPosition('H20');

// Add the chart to the worksheet
$worksheet->addChart($chart);

// Save Excel 2007 file
$filename = '33_Chart_create_line2.xlsx';
$writer = IOFactory::createWriter($spreadsheet, 'Xlsx');
$writer->setIncludeCharts(true);

$writer->save($filename);
OK thank you. I will compare code and see. I posted an issue #3446 anyway just in case.
Thanks again for taking your time to help!
Edit* Turns out the issue was Open Office (I'm cheap). For some reason when using custom values, Open Office breaks. Looks ok in Excel. Weird that workbook values are ok, and custom values are not in Open Office /shrug.
Edit2* Well MS Excel shows values, but they are not exactly matching what is being passed 100%. I noted that in my Issue post.
Edit3* I was using the "stacked" grouping from the example. Switching it to normal made everything correct and now it is perfect! Great library!
@cwolcott I am changing the implementation of Legend Borders in PR #3462 from what I did in PR #3434. It will allow more options (e.g. line width), but the former change is not compatible. I will probably merge the newer next week.
$legend->getBorderLines()->setLineColorProperties('ffc000', null, ChartColor::EXCEL_COLOR_TYPE_RGB);
That is fine. I got caught up in security vulnerabilities the last week, but plan to return to the reports by Tuesday.