Massive memory leak in liberty:dev command
This is unfortunately very hard to give information about, but I would like to report that while using the liberty:dev command, multiple times a day I find my computer frozen due to both the RAM memory (16 GB) and the swap memory (8 GB) being full, having open only a browser, an IDE, and a terminal running liberty:dev.
When observing htop, I see the memory usage increasing by a few hundred MBs with every change of the code (and subsequent automatic server restart).
Thanks for raising this issue @inad9300. Which platform are you on and which version of the Liberty Maven plugin are you using?
Are you able to provide us more information on your project such as:
- Is this a multi-module Maven project?
- pom.xml
- server.xml
- any other server or environment configuration
Is this the same application you are encountering issue https://github.com/OpenLiberty/ci.maven/issues/1588 as well?
Which platform are you on and which version of the Liberty Maven plugin are you using?
I'm on Ubuntu, and using version 3.6.1 of the plugin.
Is this a multi-module Maven project?
No, single module.
pom.xml
<?xml version="1.0" encoding="UTF-8" ?>
<project
    xmlns="http://maven.apache.org/POM/4.0.0"
    xmlns:xsi="http://www.w3.org/2001/XMLSchema-instance"
    xsi:schemaLocation="http://maven.apache.org/POM/4.0.0 http://maven.apache.org/xsd/maven-4.0.0.xsd">
    <modelVersion>4.0.0</modelVersion>

    <groupId>org.example</groupId>
    <artifactId>artifact</artifactId>
    <version>1.0.0-SNAPSHOT</version>
    <packaging>war</packaging>

    <properties>
        <maven.compiler.source>17</maven.compiler.source>
        <maven.compiler.target>17</maven.compiler.target>
        <project.build.sourceEncoding>UTF-8</project.build.sourceEncoding>
    </properties>

    <build>
        <finalName>${project.artifactId}</finalName>

        <plugins>
            <plugin>
                <groupId>io.openliberty.tools</groupId>
                <artifactId>liberty-maven-plugin</artifactId>
                <version>3.6.1</version>
                <configuration>
                    <copyDependencies>
                        <dependency>
                            <groupId>org.example</groupId>
                            <artifactId>example</artifactId>
                        </dependency>
                    </copyDependencies>
                </configuration>
            </plugin>

            <!-- Some more plugins here -->
        </plugins>
    </build>

    <dependencies>
        <dependency>
            <groupId>jakarta.platform</groupId>
            <artifactId>jakarta.jakartaee-api</artifactId>
            <version>9.1.0</version>
            <scope>provided</scope>
        </dependency>

        <dependency>
            <groupId>io.openliberty.api</groupId>
            <artifactId>io.openliberty.jaxrs30</artifactId>
            <version>1.0.68</version>
            <scope>provided</scope>
        </dependency>

        <dependency>
            <groupId>org.eclipse.microprofile</groupId>
            <artifactId>microprofile</artifactId>
            <version>5.0</version>
            <type>pom</type>
            <scope>provided</scope>
        </dependency>

        <dependency>
            <groupId>org.eclipse</groupId>
            <artifactId>yasson</artifactId>
            <version>2.0.4</version>
        </dependency>

       <!-- And a few more dependencies -->
    </dependencies>
</project>
server.xml
<?xml version="1.0" encoding="UTF-8"?>
<server>
    <featureManager>
        <feature>jakartaee-9.1</feature>
        <feature>microProfile-5.0</feature>
    </featureManager>

    <applicationManager autoExpand="true" />

    <webApplication contextRoot="/" location="artifact.war" />

    <httpEndpoint id="defaultHttpEndpoint" host="*" httpsPort="9443" />

    <httpOptions throwIOEForInboundConnections="false" />

    <ssl id="defaultSSLConfig" trustDefaultCerts="true" />

    <!-- And a few other settings (e.g. data source, variables) -->
</server>
any other server or environment configuration
I'm using Java 17, in particular Eclipse Temurin.
Is this the same application you are encountering issue https://github.com/OpenLiberty/ci.maven/issues/1588 as well?
It is, though the memory problem is much more recent than the other one, I would say.
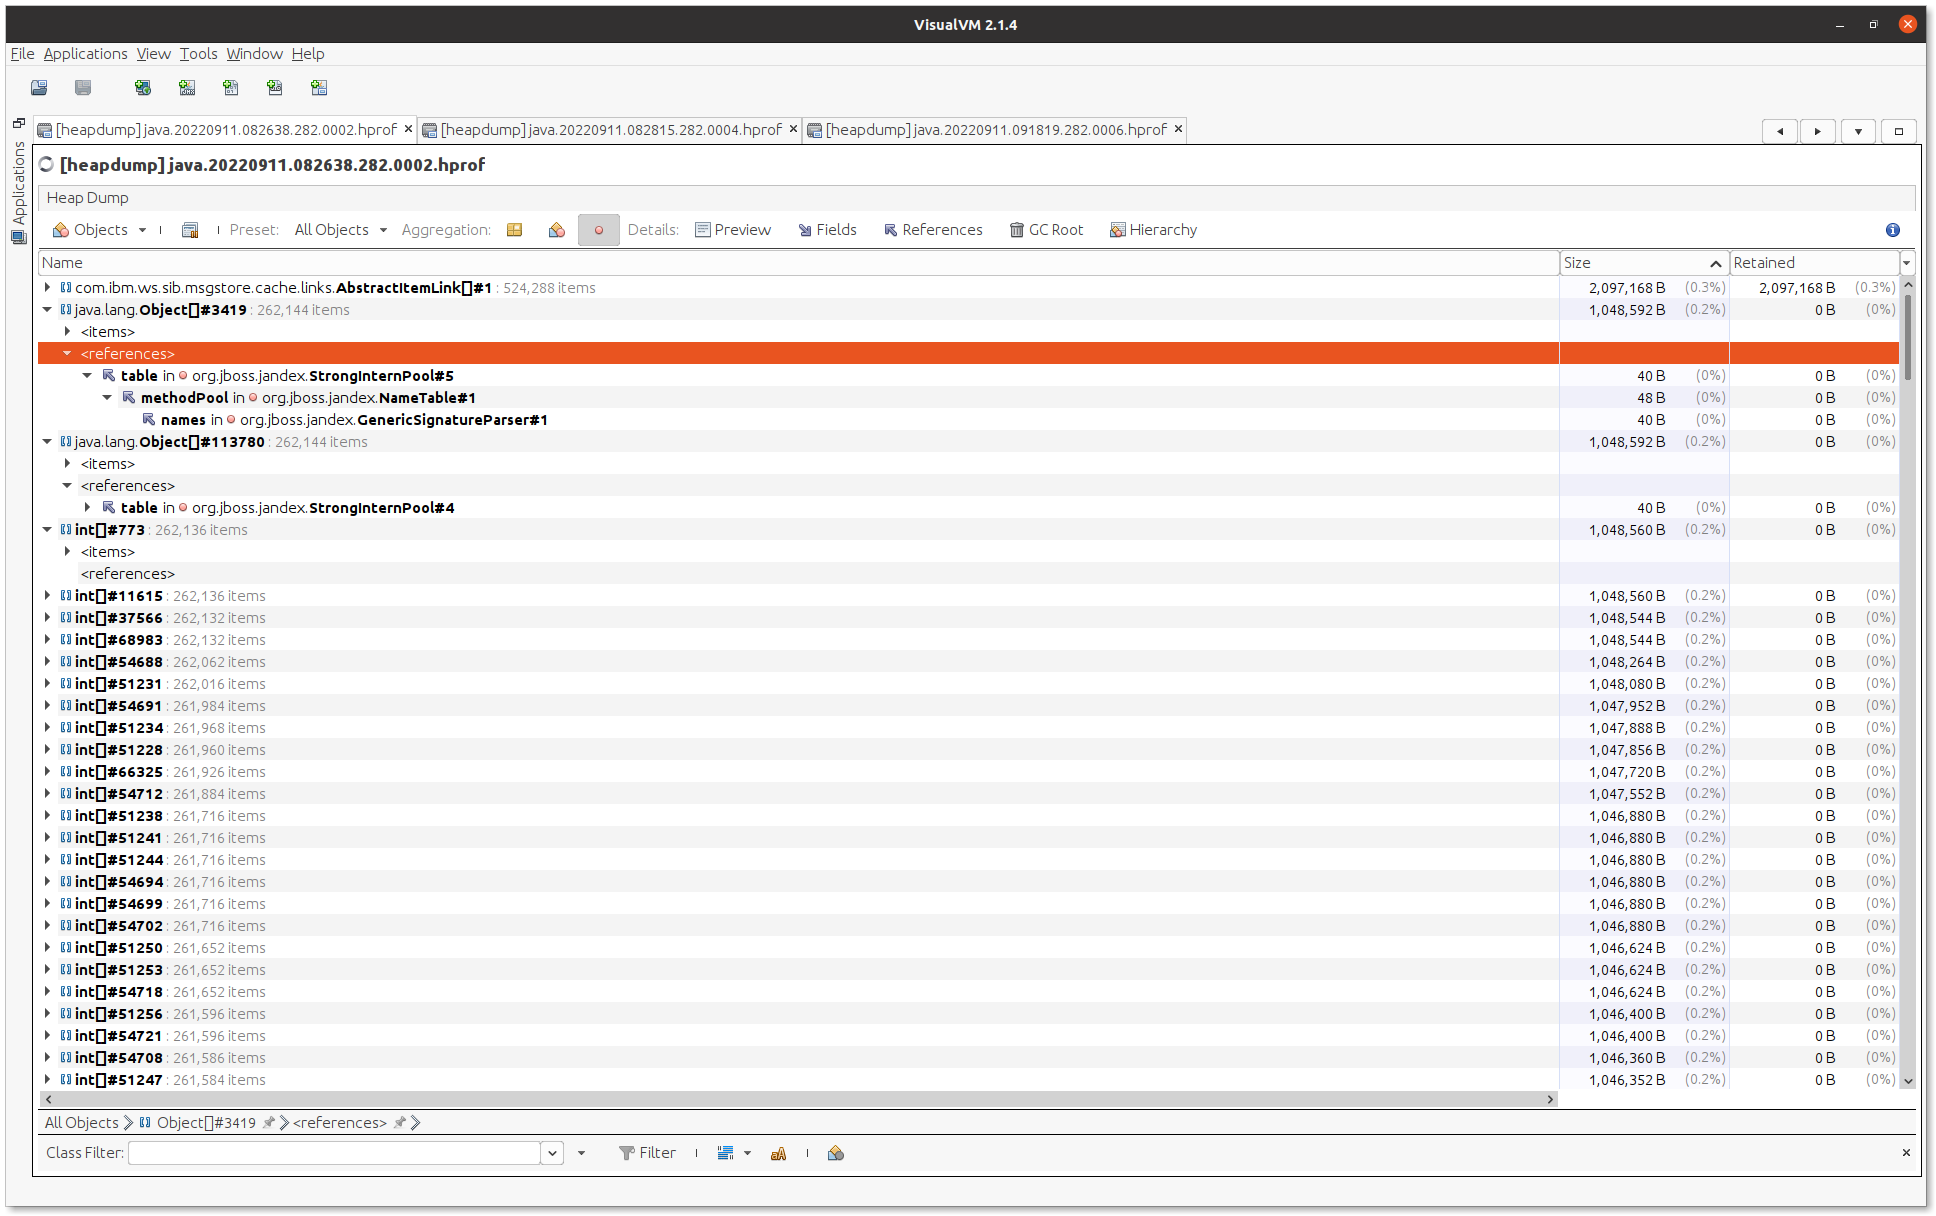
In the meantime, I thought doing some memory profiling might be helpful (though I don't have too much experience with them, I must admit). Let me include here some memory dump screenshots from VisualVM, comparing the before and after a server restart triggered by a touch of a source file:
Before restart:
After restart:
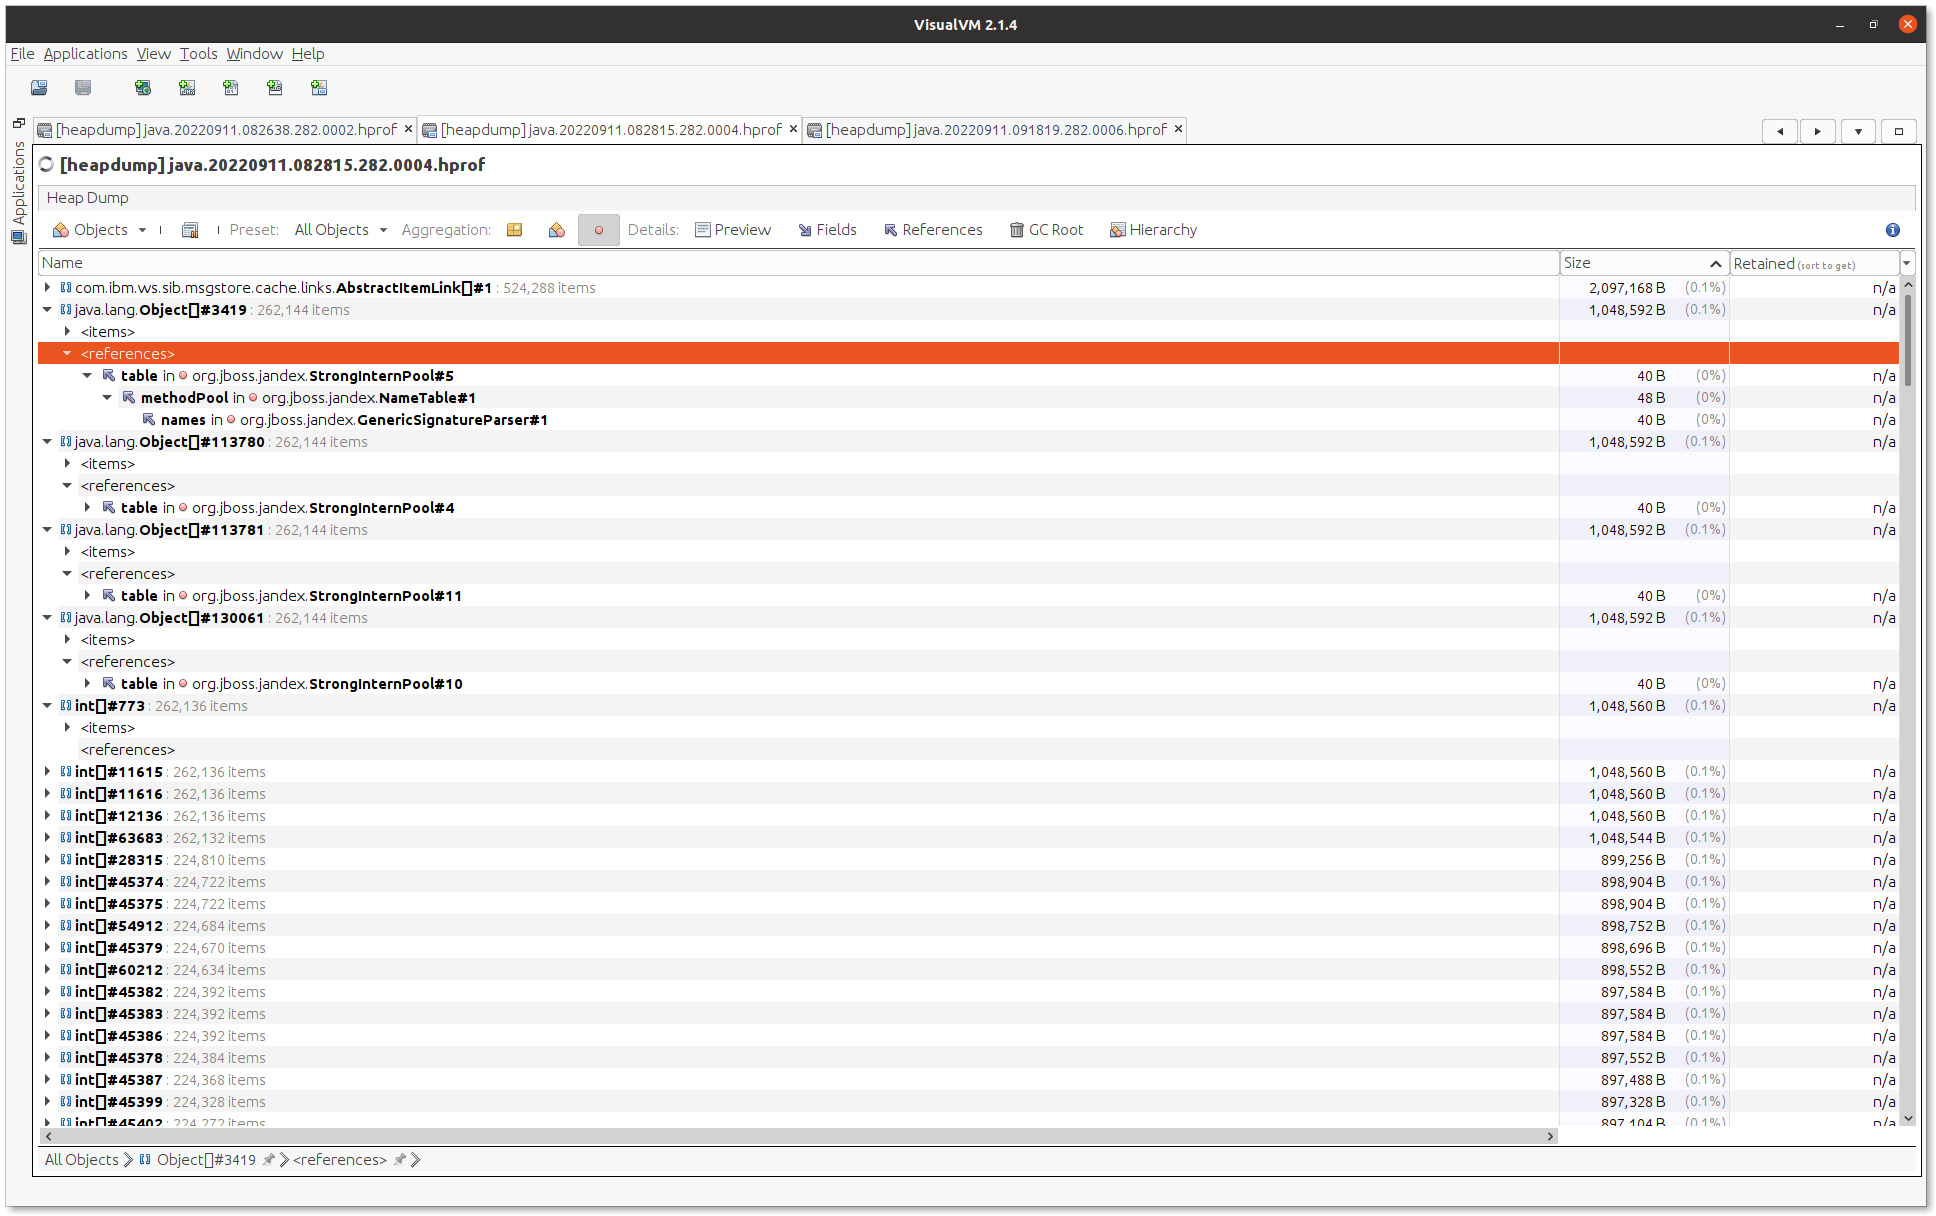
It's only a tiny slice of what VisualVM gives you (let me know if any other information would be useful), but what I find remarkable is how where before the restart you find two big Object[], after the restart you find four such arrays, all four of exactly the same size. On a subsequent restart and dump (not on any screenshot here), I can see eight Object[], again with the exact same size. Essentially, many things seem to be duplicated, not just those arrays, not sure if because of a flaw in my application, in Open Liberty, or in the Maven plugin, but I at least can't recognize the JBoss' classes shown in the screenshots as the "reference" of the big arrays of objects.
Thanks @inad9300. It is strange that the server is restarting your server after a touch of a source file. Dev mode should not be restarting the server if a source file is created or modified. Would you be able to capture and share the debug output when triggering a touch event? You can produce the debug output with mvn liberty:dev -X.
Additionally, the Liberty Maven Plugin 3.6.1 does not currently support Java 17. However, we have a snapshot available for testing Java 17 support. You can try that out by configuring the Sonatype repository and adjusting your Liberty Maven Plugin version to 3.7-SNAPSHOT and see if that makes a difference.
<project>
    ...
    <pluginRepositories>
        <!-- Configure Sonatype OSS Maven snapshots repository -->
        <pluginRepository>
            <id>sonatype-nexus-snapshots</id>
            <name>Sonatype Nexus Snapshots</name>
            <url>https://oss.sonatype.org/content/repositories/snapshots/</url>
            <snapshots>
                <enabled>true</enabled>
            </snapshots>
            <releases>
                <enabled>false</enabled>
            </releases>
        </pluginRepository>
    </pluginRepositories>
    ...
    <build>
        <plugins>
            <!-- Enable liberty-maven-plugin -->
            <plugin>
                <groupId>io.openliberty.tools</groupId>
                <artifactId>liberty-maven-plugin</artifactId>
                <version>3.7-SNAPSHOT</version>
                <!-- Specify configuration, executions for liberty-maven-plugin -->
                ...
            </plugin>
        </plugins>
    </build>
</project>
I just want to add a caveat to the mvn liberty:dev -X command. My first thought would be to redirect this to a file in the project root directory. However this will send dev mode in an infinite loop since dev mode watches files in this location. So be sure to redirect this -X output to some other directory !
Please, find below the output after executing ./mvnw liberty:dev --debug, then touch /app/src/main/java/example/util/StringUtils.java.
To make sure we are in the same page, what I mean by "server restart" is that I see messages indicating that the application has stopped and started again. I found it reasonable that this happened, so it's good to know that it wasn't supposed to.
[DEBUG] Processing events for watched directory: /app/src/main/java/example/util
[DEBUG] Changed: StringUtils.java; ENTRY_MODIFY
[DEBUG] Processing file changes for /app/src/main/java/example/util/StringUtils.java, change type MODIFY
[DEBUG] (org.codehaus.mojo.pluginsupport.ant.AntHelper) CWWKM2014I: Now looking for CWWKZ0003I: in messages.log.
[DEBUG] (org.codehaus.mojo.pluginsupport.ant.AntHelper) CWWKM2015I: Match number: 1 is [9/20/22, 9:02:38:086 UTC] 00000055 com.ibm.ws.app.manager.AppMessageHelper                      A CWWKZ0003I: The application app updated in 4.683 seconds..
[DEBUG] (org.codehaus.mojo.pluginsupport.ant.AntHelper) CWWKM2015I: Match number: 2 is [9/20/22, 9:02:41:681 UTC] 00000048 com.ibm.ws.app.manager.AppMessageHelper                      A CWWKZ0003I: The application app updated in 3.503 seconds..
[DEBUG] Message occurrences before compile: 2
[DEBUG] Java source file modified: StringUtils.java. Adding to list for processing.
[DEBUG] (org.codehaus.mojo.pluginsupport.ant.AntHelper) CWWKM2014I: Now looking for CWWKZ0003I: in messages.log.
[DEBUG] (org.codehaus.mojo.pluginsupport.ant.AntHelper) CWWKM2015I: Match number: 1 is [9/20/22, 9:02:38:086 UTC] 00000055 com.ibm.ws.app.manager.AppMessageHelper                      A CWWKZ0003I: The application app updated in 4.683 seconds..
[DEBUG] (org.codehaus.mojo.pluginsupport.ant.AntHelper) CWWKM2015I: Match number: 2 is [9/20/22, 9:02:41:681 UTC] 00000048 com.ibm.ws.app.manager.AppMessageHelper                      A CWWKZ0003I: The application app updated in 3.503 seconds..
[DEBUG] Message occurrences before compile: 2
[DEBUG] Recompiling Java source files: [/app/src/main/java/example/util/StringUtils.java]
[DEBUG] (org.codehaus.mojo.pluginsupport.ant.AntHelper) CWWKM2014I: Now looking for CWWKZ0003I: in messages.log.
[DEBUG] (org.codehaus.mojo.pluginsupport.ant.AntHelper) CWWKM2015I: Match number: 1 is [9/20/22, 9:02:38:086 UTC] 00000055 com.ibm.ws.app.manager.AppMessageHelper                      A CWWKZ0003I: The application app updated in 4.683 seconds..
[DEBUG] (org.codehaus.mojo.pluginsupport.ant.AntHelper) CWWKM2015I: Match number: 2 is [9/20/22, 9:02:41:681 UTC] 00000048 com.ibm.ws.app.manager.AppMessageHelper                      A CWWKZ0003I: The application app updated in 3.503 seconds..
[DEBUG] Message occurrences before compile: 2
[DEBUG] Compiler options: [-g, -parameters, -nowarn, -source, 17, -target, 17]
[INFO] Source compilation was successful.
[DEBUG] Processing events for watched directory: /app/target/classes/example/util
[DEBUG] Changed: StringUtils.class; ENTRY_MODIFY
[DEBUG] Processing file changes for /app/target/classes/example/util/StringUtils.class, change type MODIFY
[DEBUG] (org.codehaus.mojo.pluginsupport.ant.AntHelper) CWWKM2014I: Now looking for CWWKZ0003I: in messages.log.
[DEBUG] (org.codehaus.mojo.pluginsupport.ant.AntHelper) CWWKM2015I: Match number: 1 is [9/20/22, 9:02:38:086 UTC] 00000055 com.ibm.ws.app.manager.AppMessageHelper                      A CWWKZ0003I: The application app updated in 4.683 seconds..
[DEBUG] (org.codehaus.mojo.pluginsupport.ant.AntHelper) CWWKM2015I: Match number: 2 is [9/20/22, 9:02:41:681 UTC] 00000048 com.ibm.ws.app.manager.AppMessageHelper                      A CWWKZ0003I: The application app updated in 3.503 seconds..
[DEBUG] Message occurrences before compile: 2
[INFO] (org.codehaus.mojo.pluginsupport.ant.AntHelper) [AUDIT   ] CWWKT0017I: Web application removed (default_host): http://6d33ea13a3bb:9080/
[INFO] (org.codehaus.mojo.pluginsupport.ant.AntHelper) [AUDIT   ] CWWKZ0009I: The application app has stopped successfully.
[INFO] (org.codehaus.mojo.pluginsupport.ant.AntHelper) [WARNING ] SROAP04005: Could not find schema class in index: com.ibm.websphere.jaxrs20.multipart.IAttachment
[INFO] (org.codehaus.mojo.pluginsupport.ant.AntHelper) [AUDIT   ] CWWKT0016I: Web application available (default_host): http://6d33ea13a3bb:9080/
[INFO] (org.codehaus.mojo.pluginsupport.ant.AntHelper) [AUDIT   ] CWWKZ0003I: The application app updated in 3.214 seconds.
@inad9300, thank you for the information and for confirming that you still see the issue with the 3.7-SNAPSHOT. To clarify, an application restart is expected after a code change, or when a new source file is added, as it has been in this case. A server restart would not have been expected and is not occurring here. The debug output looks normal.
As you noted, the latest release of the Liberty Maven Plugin, version 3.7, will not resolve this issue, but it will provide you with proper Java 17 support, so you may want to use the new version from now on.
Now, onto the memory leak. We also do not recognize those JBoss classes shown as the reference for the Object arrays that are multiplying. The Liberty Maven Plugin does not make use of any jandex packages. Which JVM were you monitoring for those heap dump screenshots - the JVM for your application or the JVM for the dev mode process? Regardless of which one it is, could you recreate the problem and provide a heap dump file from the time of the crash for us to analyze?
Hi @TrevCraw. I actually don't remember which JVM I was monitoring, to be honest, just the one which was leaking memory. The heap dumps are more than a gigabyte, so sharing them is tricky.
I have prepared, however, a minimal repository which I believe is able to reproduce the issue, even though at a much smaller scale. You can find it at https://github.com/inad9300/open-liberty-demo-app.
The basic idea is to start a Docker container where three things are run in parallel: the Open Liberty application, something like top for monitoring, and a periodic touch of a source file to trigger application restarts and thus reproduce the memory leak (the exact commands I have used can be found in the README file).
The longer you leave the periodic touch command running, the more memory usage grows. When stopping the command and waiting a bit, memory usage doesn't shrink. When resuming the command, memory usage goes back to growing. It doesn't grow by much each time, so the assumption here is that as the project becomes more complex (bigger number of source files, more dependencies, parameters like -DrecompileDependencies=true, etc.) the leak will be larger.
Have you managed to have a look at this problem? Could you reproduce it through my demo app? I'm still dealing daily with it.
Let me stop and note that I sort of recreated the problem following the directions in the sample app: https://github.com/inad9300/open-liberty-demo-app (thank you very much for such a detailed recreate setup).
So below PID 268 is the Liberty server and PID 84 is mvn running dev mode:
after maybe 5-10 min.
MiB Mem :   1985.5 total,     71.0 free,   1799.8 used,    114.7 buff/cache
MiB Swap:   1024.0 total,    984.4 free,     39.6 used.     54.6 avail Mem
  PID USER      PR  NI    VIRT    RES    SHR S  %CPU  %MEM     TIME+ COMMAND
  268 root      20   0 3250616 880244  22248 S  54.3  43.3   3:53.53 java
   84 root      20   0 3091388 640856  27828 S  16.7  31.5   2:10.69 java
after maybe another 5 min
MiB Mem :   1985.5 total,    122.2 free,   1773.7 used,     89.5 buff/cache
MiB Swap:   1024.0 total,    918.3 free,    105.7 used.     93.4 avail Mem
  PID USER      PR  NI    VIRT    RES    SHR S  %CPU  %MEM     TIME+ COMMAND
  268 root      20   0 3251032 917792  20796 S  36.2  45.1   5:27.99 java
   84 root      20   0 3091388 632764  19344 S  20.6  31.1   2:43.04 java
after maybe another 2-3 min
MiB Mem :   1985.5 total,    118.3 free,   1778.2 used,     89.0 buff/cache
MiB Swap:   1024.0 total,    918.3 free,    105.7 used.     89.3 avail Mem
  PID USER      PR  NI    VIRT    RES    SHR S  %CPU  %MEM     TIME+ COMMAND
  268 root      20   0 3251032 920456  20836 S  33.7  45.3   6:12.02 java
   84 root      20   0 3091388 633408  19388 S  19.3  31.2   3:05.31 java
I'm not too experienced in analyzing this kind of thing but some observations:
- The RES column for the server process seems to steadily go up
- The RES column for mvn seems to mostly steadily go up but sometimes goes down
- The MiB Mem 'used' seems to mostly go up but sometimes down.
So from my naive perspective that the memory usage in the Liberty server might be more of an issue than from the mvn process.
@inad9300 how many application restarts would you say you achieve before you notice a problem in practical terms (e.g. something crashes or starts thrashing and slowing down) ? E.g. on the order of 10 ? Less? More? Thanks.
I would say it takes in the order of 100 source code changes/application restarts before I run out of free memory. Possibly some more, but definitely not 1000, and definitely not 10.
Uh, oh! I think I have found at least one possible culprit for the problem. I've had this suspicion before, but never got around to test it: static fields are leaked! Or so it seems to me. If you allocate some memory in a static field and re-run the experiment, you'll see that with every restart, the memory usage reported by top increments by an amount approximately equal to the amount of memory allocated in the static field. For example, I have added the following in RestApplication.java:
static final ByteBuffer buf = ByteBuffer.allocate(100_000_000); // Allocate 100 MB.
By the way, regarding this interesting observation:
the memory usage in the Liberty server might be more of an issue than from the mvn process.
Does this mean that the problem could rather be with the Open Liberty runtime instead of with the Maven plugin? (In any case, sorry if I put the blame in the wrong place, I just thought "since the app restarts triggered by source code changes only happen via liberty:dev, then liberty:dev must be the cause", which isn't necessarily the case.)
No need to apologize... the user experience is just "running dev mode" and ideally you don't have to worry about which JVM is leaking. We'll probably end up closing the issue but let me leave it open to dig into this a bit and see what I can suggest (either opening an issue on the runtime or doing some app-level debug). Thanks for including such a detailed recreate and sorry we didn't try it sooner.
OK, I'd suggest taking a set of heap dumps and using a tool to analyze them. This could either be the one you mentioned, VisualVM, which I'm not familiar with, or another option is the Eclipse Memory Analyzer: https://publib.boulder.ibm.com/httpserv/cookbook/Major_Tools-Eclipse_Memory_Analyzer_Tool.html
(There are a couple other small pointers mentioned here: https://publib.boulder.ibm.com/httpserv/cookbook/Troubleshooting_Recipes-Troubleshooting_Memory_Leaks.html)
Many of these problems turn out to be application issues. In general I'd think that a static field of an application class would be "kept alive" by the application classloader, and so when the app was recycled (stopped/started), the old classloader would go away (get garbage collected) and this field could then get freed up as well. But there could be any number of things going on in the app and the libraries it uses to keep an active reference to these objects.
If after doing an analysis you feel like you have a case for there being an issue with the Liberty runtime please then open an issue at: https://github.com/OpenLiberty/open-liberty/issues.
Feel free to reach out on our Gitter channel as well: https://gitter.im/OpenLiberty/developer-experience
I'm going to close this issue for now. Thank you.