Report's Correlation View does not show all "correlated" data
Description
There are several clues to suggest that not all correlated objects (and their reports) are being represented in the Correlation view.
First: often times, the "Related Reports" section in the Report Overview includes reports that are not visible in the Correlation view, suggesting that some data is not being represented.
Second: the "filter entity types" functionality at the bottom of the Correlation view shows object types that are not actually present in the Correlation view
Third: expanding on the report in the Investigations tab, and then on the resulting objects, offers final proof that not all correlations are being represented.
Environment
- OS (where OpenCTI server runs): Ubuntu 18
- OpenCTI version: 5.3.7
- OpenCTI client: frontend
- Other environment details:
Reproducible Steps
Steps to create the smallest reproducible scenario:
- Enter data into Report #1 that is contained in other Reports
- Go to Report #1's correlation view
- Compare against the Reports that show up in Report #1's "Related Reports" section in the overview, as well as the reports that share observables
Expected Output
All reports that share observables or (some?**) entities are presented, together with the objects themselves
Actual Output
A subset of correlating objects and reports is displayed
Additional information
I am waiting for the demo OpenCTI instance to come back online to provide example screenshots of this from 5.3.12.
**Also it would be useful to get clarification about what objects are considered "correlating" for this view. For example:
- After testing, it is clear that Related Reports (in the overview section) shows only the reports that share observables with the current report
- This is not the case for the Correlation view, as often entities/SDOs are presented. However, it's not clear if all entities are used to correlate, or only some? Partially due to this bug. It might be useful to allow a user select which objects are used to correlate. For example, if a report has the United States, it may be distracting to include every other report that references the United States.
Screenshots (optional)
Perhaps what might be most useful is an explainer of what the Correlation View is intended to display. An example from the demo instance (5.3.12):
Example
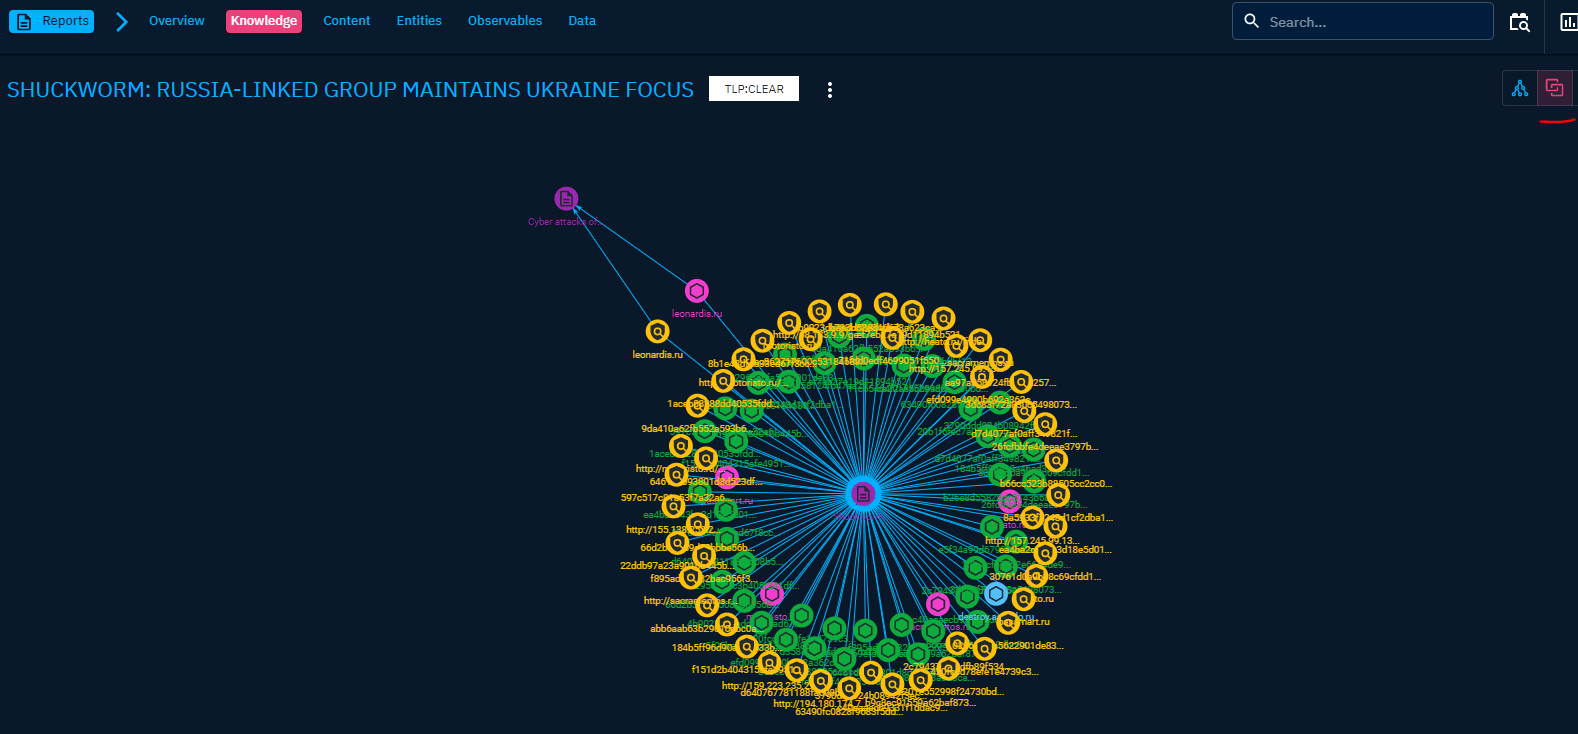
Report: Shuckworm: Russia-Linked Group Maintains Ukraine Focus https://demo.opencti.io/dashboard/analysis/reports/18e0328a-706a-4148-97d5-2d73a5a6c126
Screenshot 1: shows the correlation view for this report. Lots of files, indicators are listed (it's not clear why, as they don't have relationships to reports other than the selected report), and there are connection to a single, other report.
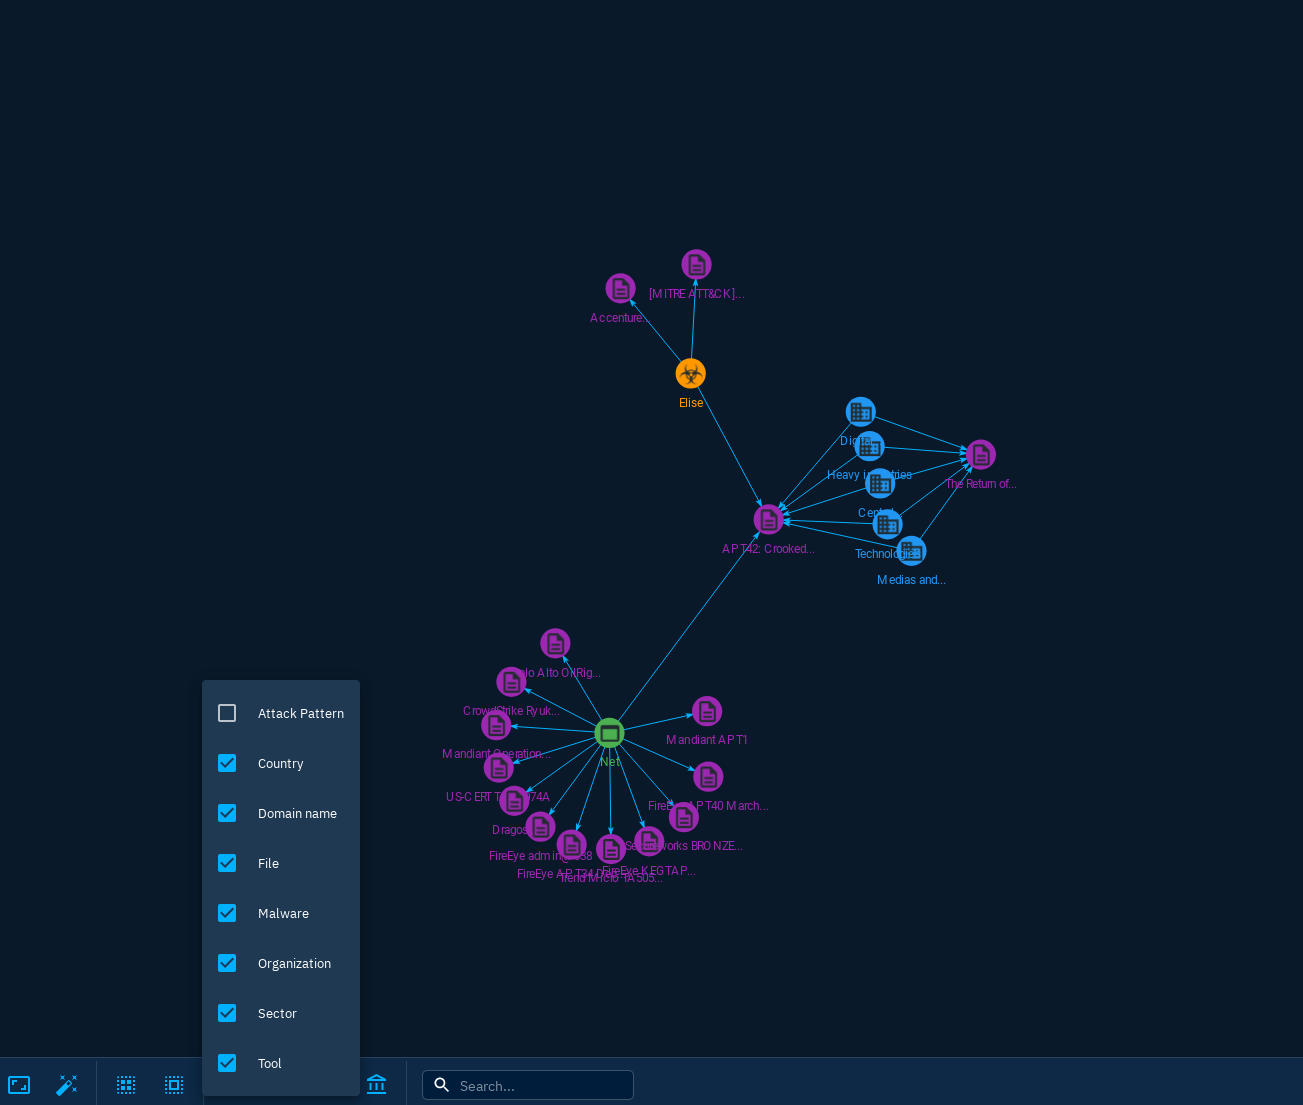
Screenshot 2: shows that this report contains several attack patterns. There are other reports that contain these attack patterns, but they are not displayed in the correlation view (above):

I'm going to venture a guess that the reason Attack Patterns don't show up is primarily due to the following code at line 1058 in opencti-platform/opencti-front/src/private/components/analysis/reports/ReportKnowledgeCorrelation.js.
        objects(
          types: [
            "Threat-Actor"
            "Intrusion-Set"
            "Campaign"
            "Incident"
            "Malware"
            "Tool"
            "Vulnerability"
            "Stix-Cyber-Observable"
            "Indicator"
          ]
          first: 100
Ok, I think the above PR fixes most of the issues described here:
- Not showing some node types at all (due to hard-coded limitation)
- Not showing all related reports (due to hard-coded numeric caps)
- Showing linked entities that only link to this report an no others (too low of a "linked report" cap)
Here's some screenshots:
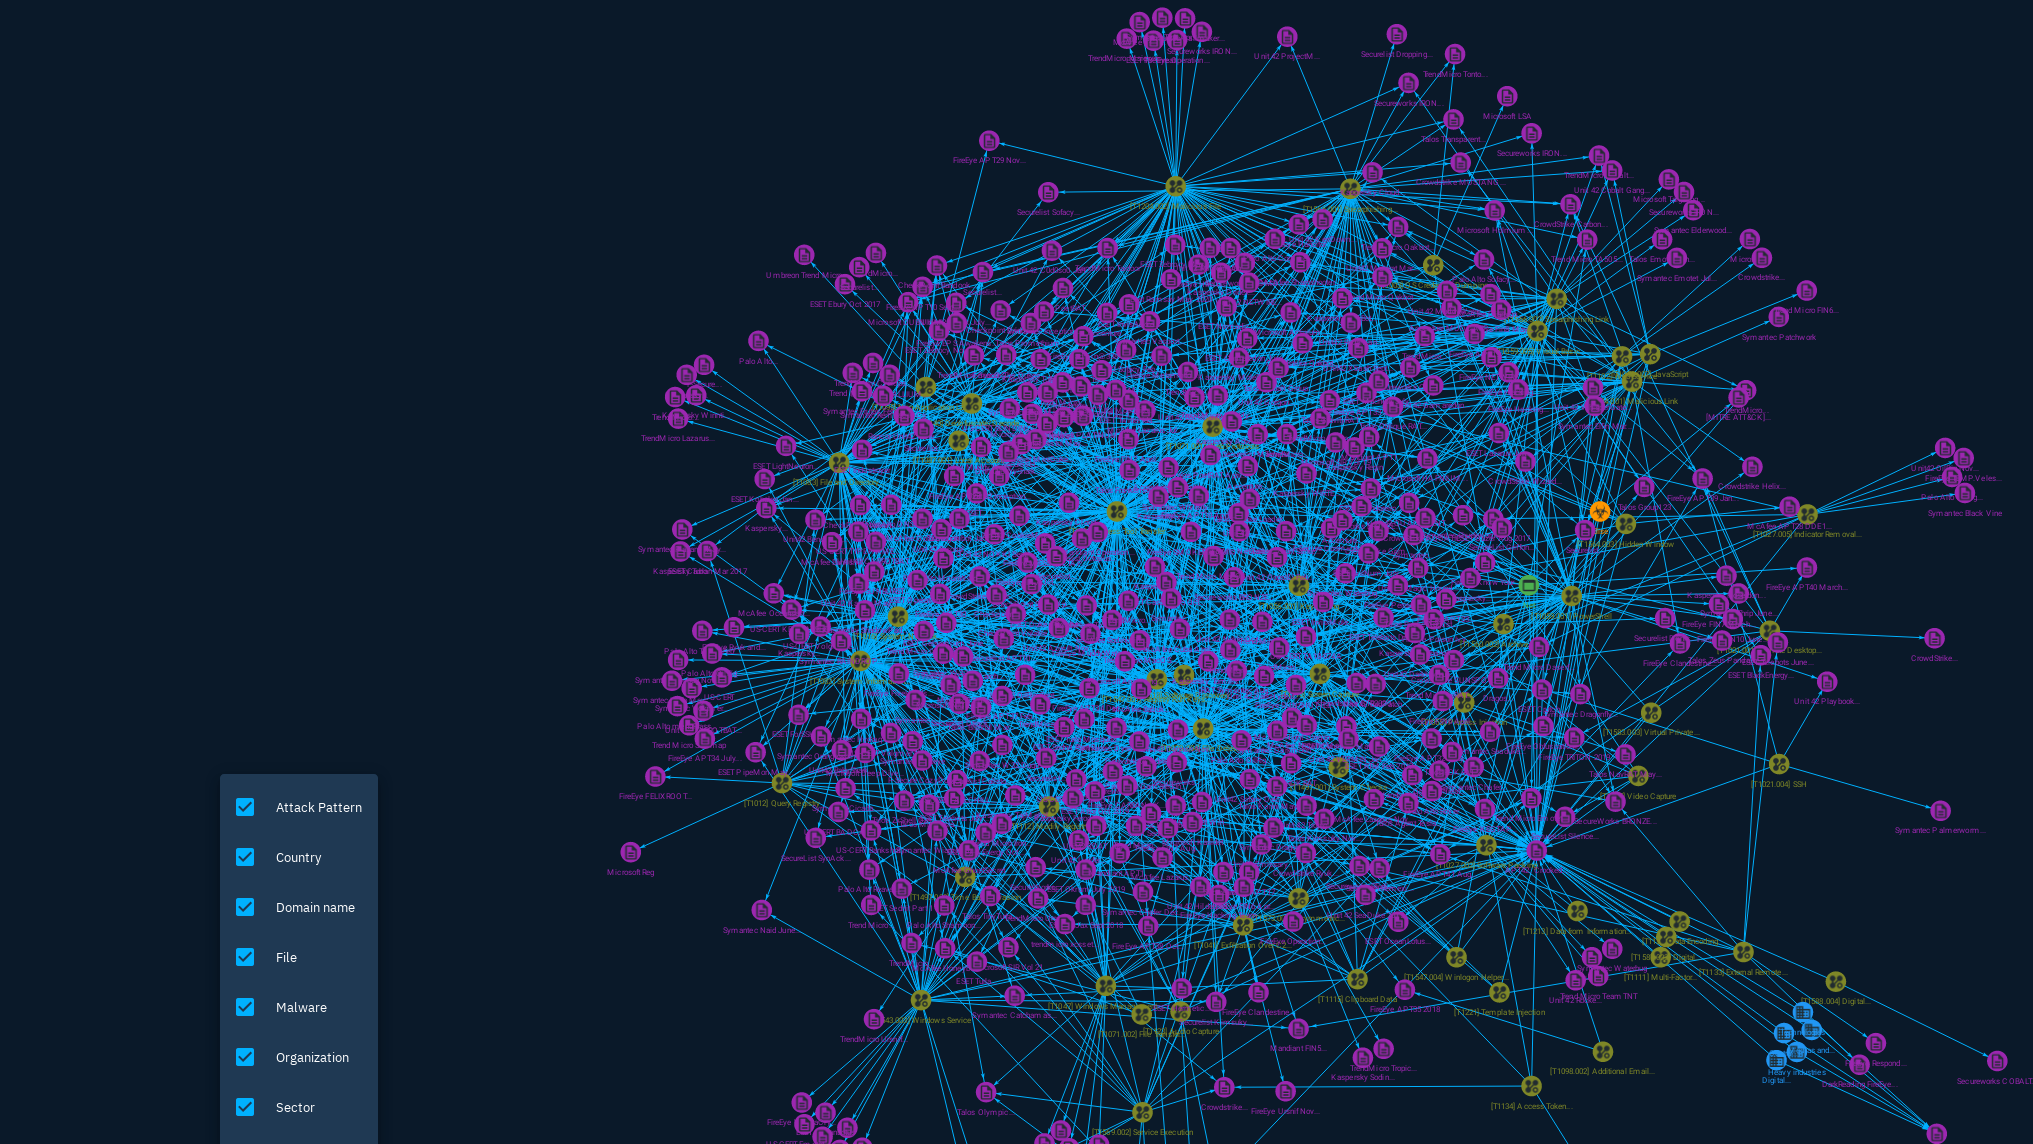
Be advised that some node types like Organization, Country, Attack Pattern, or Sector, will quickly grow to have a high amount of inter-report links, which is one reason the hard-coded list existed in my prior comment. That said, it is arguably best left up to the analyst user to decide what they do/don't want shown on these charts and not best practice to hard-code this into the software itself. Also, the rendering engine seems to handle large amounts of graphed objects fairly well.
Some additional context. This is in 5.3.7:
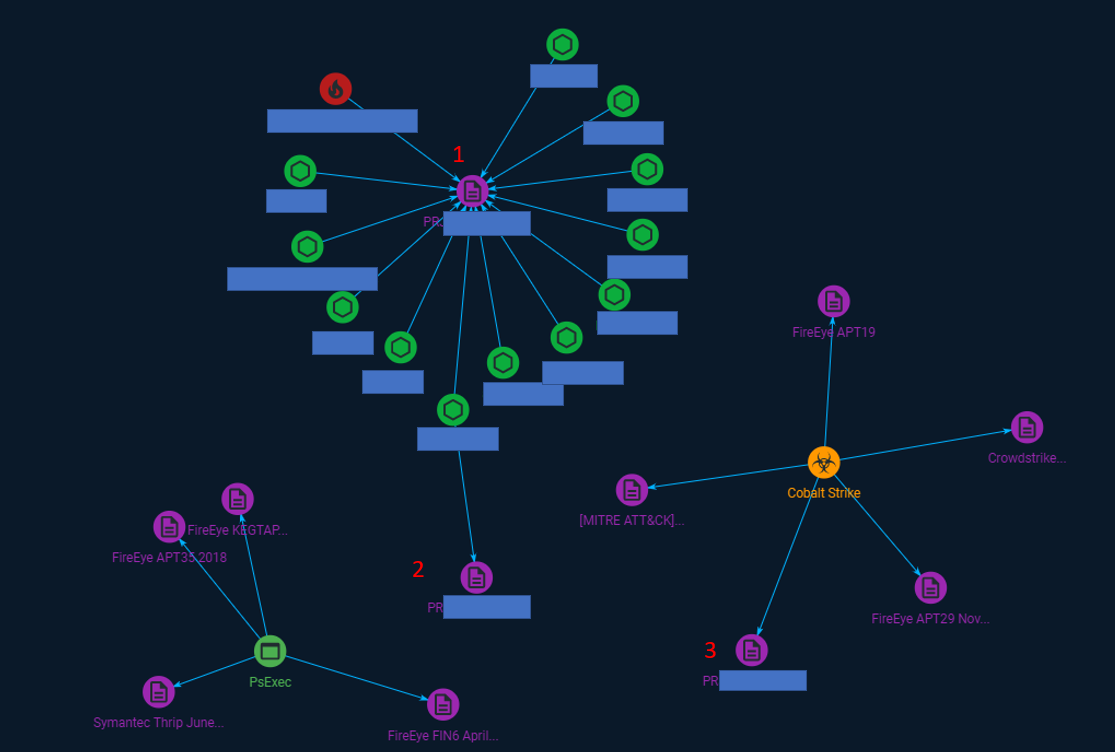
The below screenshot shows that a report shares observables with 5 different reports that start with "PR", and one that starts with "Ind"
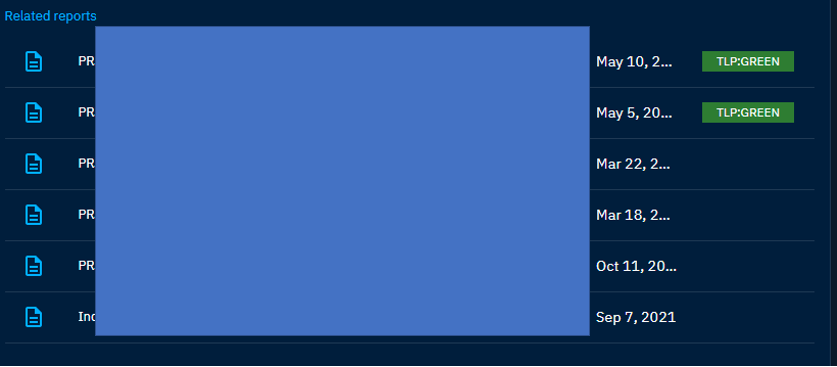
The correlation view, however, shows this:
- The object marked "1", which is the selected report (not a correlation)
- It's not clear why the File observables related to "1" are listed, as they don't have relationships with any other report other than the selected report
- The object marked "2", which is the only report that starts with "PR" that actually shares an observable with the original report (remember, the Related Reports said there were 5)
Lastly, while not applicable in this case (so no screenshot available), but I've seen instances where when opening the filter option in the Correlation View, shows that there should be other types of objects visible, but they are not.
So, there were a few arbitrary hard-coded limits that were left in the original code (you can blame me for that).
The list of type restrictions I captured above are now removed entirely with my patch.
In addition to that, there were also a couple places where an arbitrary numeric upper-limit was left in the code - the original purpose was to keep graphs small for rapid testing, but I didn't notice them before my last contribution of this code. Testing on my system suggests that this might help fix the issue where you see the isolated, disconnected islands of report relationships (label 3 in your chart). Basically, the edges were not all being drawn, and in some cases the list of entity nodes relating reports was being truncated before drawing, so whole nodes, with edges, were not being drawn too.
Finally, there was a test that was originally intended to test for "1 or more additional report relationships", but I refactored that part of the code later on to remove some function calls. As a result, this was testing the entire list of reports containing an entity against the logic "1 or more". I bumped that number to test for "2 or more" and so now you should not see any "leaf node" entities on the graph that aren't report nodes. This should fix all the singleton green nodes you have relating to object (1) in your most recent chart above.
The real test will be seeing how this improves the visualization of your data, however.
After these changes end up in a new release, reach out (open another issue, referencing this one) if there continues to be more defects in these graphs.
@securitiz - it looks like this improvement made it into 5.3.17, and it appears to be addressing at least two of the issues you ran into: some elements not being rendered as related, and singleton entities (from this report, not related to any other reporting) showing up on the graph and taking up space. Mind updating and letting me know if it covers all your issues?