OpenBCI_GUI
 OpenBCI_GUI copied to clipboard
Spectrogram Improvements - v4.2.0
This is a collection of Spectrogram issues found with GUI 4.2.0-alpha, Win10, Ganglion. It has been atremendous effort of @retiutut to reach this level. Thank you, You made it! Some minor bugs/ shortcomings I noticed so far:
-
[x] 1)After start of GUI I can not select spectrogram. It does not appear in the popup. I need to change layout first then it is possible.
-
[x] 2) Frequencies are not displayed correctly Compare with FFT plot. That is correct. For example 50 Hz hum is not displayed at 50Hz. It is displayed at ~ 62.5 Hz instead 10Hz is giving 12.5 etc
I noticed that the signal is heavily distorted but this I have to investigate further. It seems to be a hardware problem.
-
[ ] 3) Gain too low: Blue should be 0.1uV Red100uV ( like fft). Now blue seem to be 10uV If the signal is > 100uV you may blank the spectrum (all white) indicating artifact
-
[ ] 4)There should be a possibility to set the time span of spectrogram1,2,5,10,20,50 min
-
[ ] 5)When no channel is selected there should be all blue displayed. Instead it is red now( full signal) Alternatively this may be white ( see above)
4)There should be a possibility to set the time span of spectrogram1,2,5,10,20,50 min
This is adjusted using the number of Samples, may not be able to fit another dropdown, or I will have to remove the Save Spectrogram button.
1)After start of GUI I can not select spectrogram. It does not appear in the popup. I need to change layout first then it is possible.
I would need a screenshot of this also. Try using the widget selector and scrolling with mouse. Spectrogram can also be moved towards the top, this needs to be cleared first.
Ad 1)
Here the screen shot:
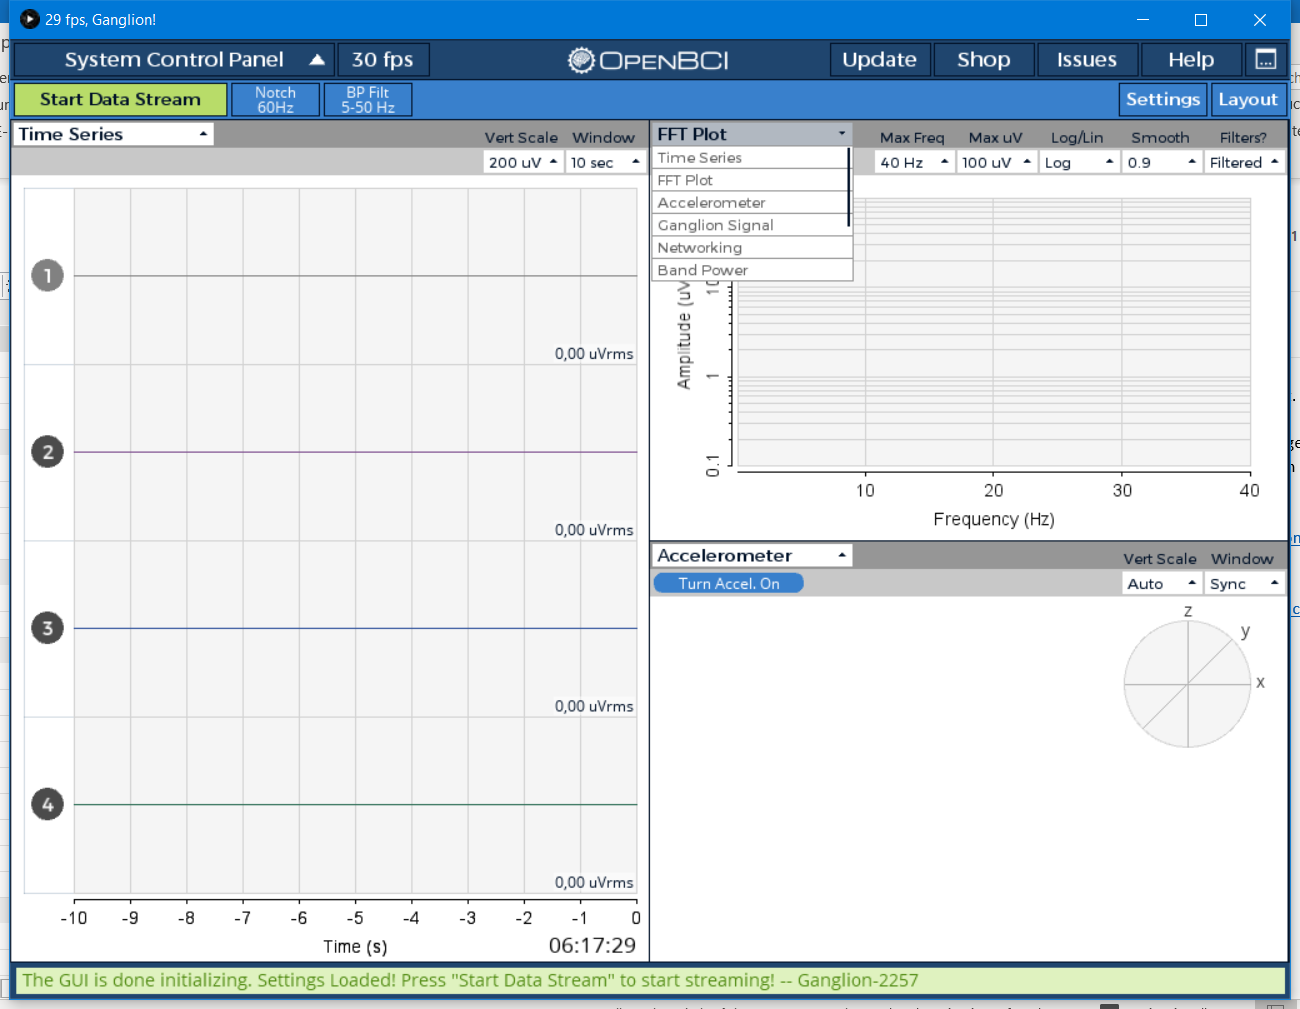 To reproduce this you need to close GUI WITHOUT having spectrogram selected.
Then if you change layout you get this
To reproduce this you need to close GUI WITHOUT having spectrogram selected.
Then if you change layout you get this
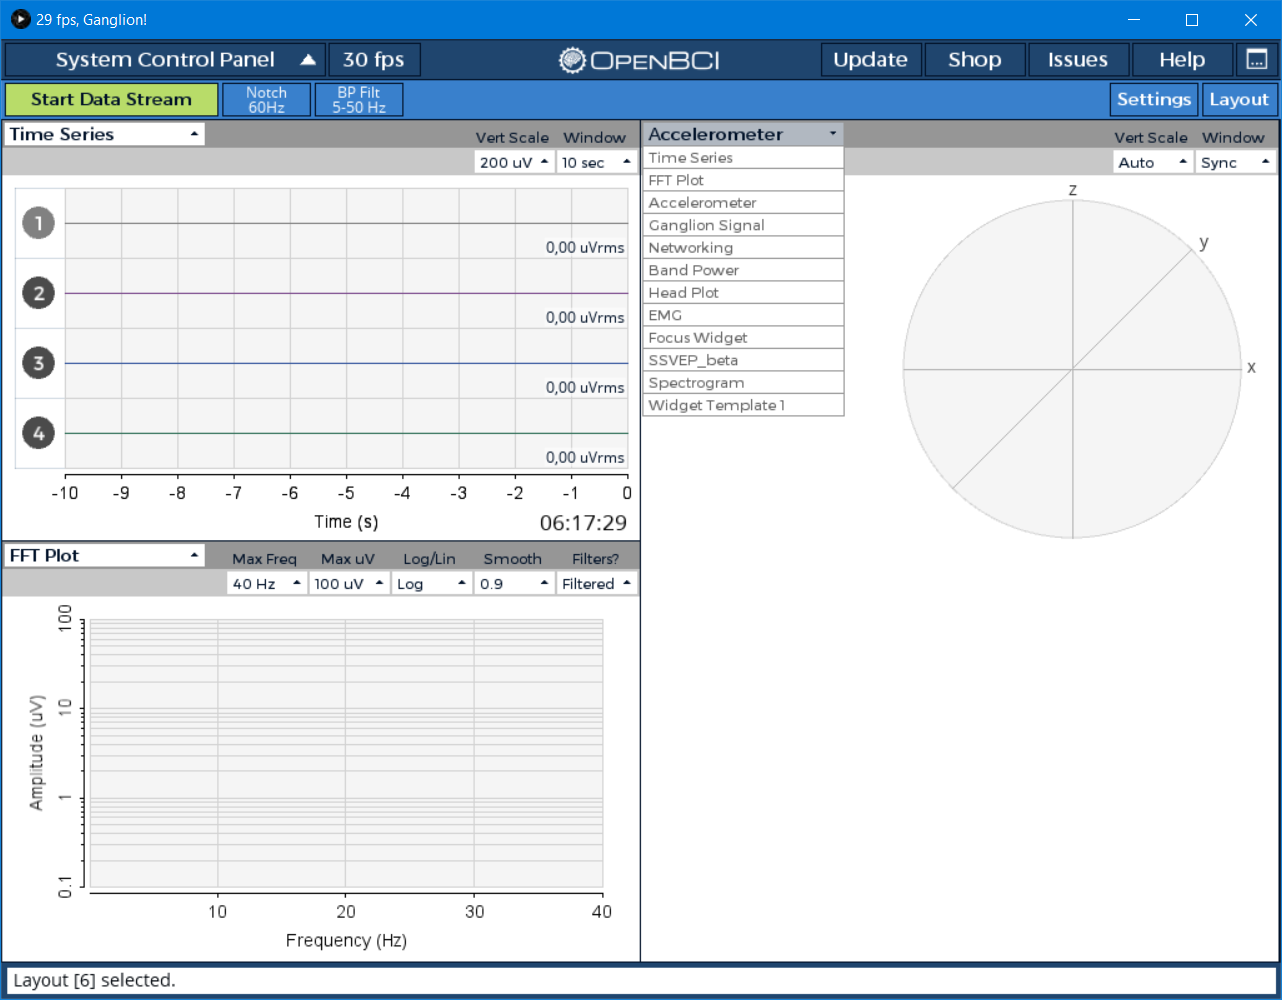 Then everything works as expected
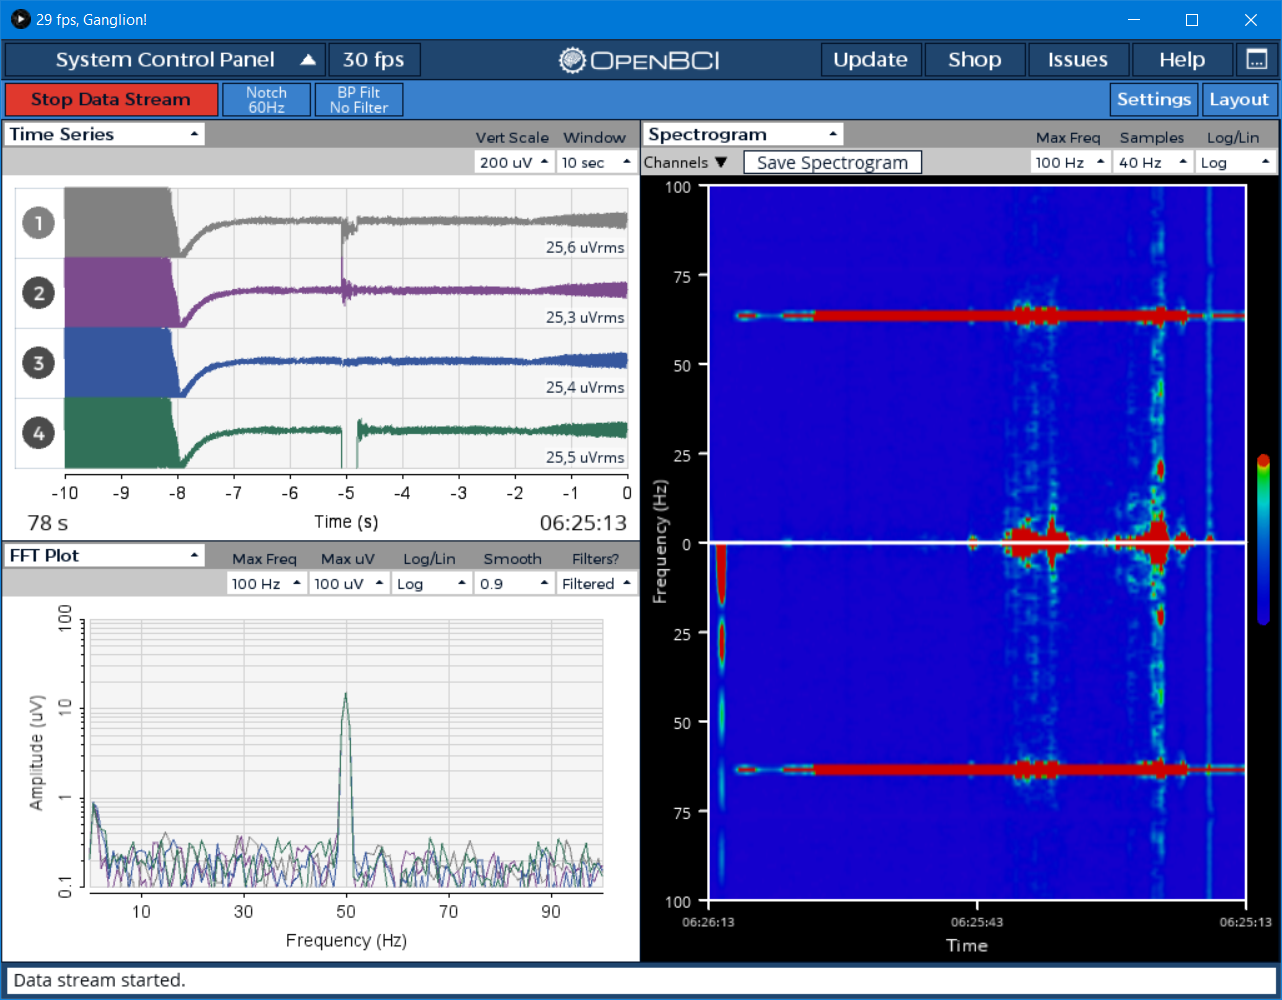
Ad2:
You can see the FFT displays correctly the 50Hz while the spectrogram does not
Ad 4) I do not understand There should be a dropdown like the window in the time series selecting the span of the x axis. ( 1,2,5,10,20,50 min . However showing absolute time should remain of course. Save spectrogram should remain. Maybe short text to save image It is the main purpose of the spectrogram to have information visible from the past. You may see the effect of meditation , drugs etc.
Ad 3) you may add a kind of a gain dropdown menu setting doing blue = 0,1uV, 1uV, 10 uV . the span should always be 3 decades. I do not see a benefit from linear scale . You may skip this setting
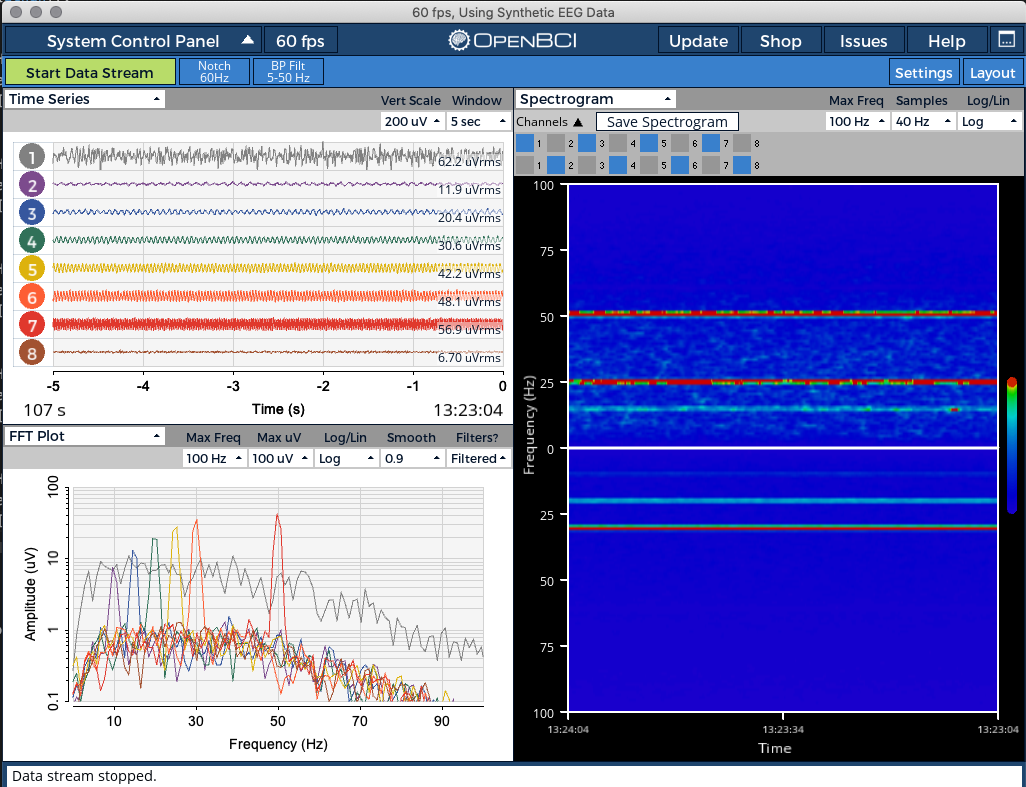
Working on Ad 2, I was able to check 50 Hz using Synthetic mode. I would check the "Channel Select" dropdown. I would say 50Hz is slightly off, but not by much.
Looks good, Not sure what you want to say. Have you changed something that it is ok now?
Frequency reading should be consistent with FFT plot.
Remark: To display 50Hz you should switch BP filter 5-50 to No filter
Channel 7 has synthetic 50 Hz noise, as you can see in the FFT and TimeSeries.
Remark: To display 50Hz you should switch BP filter 5-50 to No filter
😄

The very thin line at the bottom is actually Channel 8, and I did turn it off for momentarily.