[FR] Tom DeMark's Sequential Indicator, from pandas-ta
The proprietary version of this indicator (https://demark.com/sequential-indicator/) has been recreated in the pandas-ta library, used by the OpenBB Terminal. https://github.com/twopirllc/pandas-ta#new-indicators
Tom DeMark's Sequential (td_seq) attempts to identify a price point where an uptrend or a downtrend exhausts itself and reverses. Currently exlcuded from df.ta.strategy() for performance reasons. See help(ta.td_seq)
This indicator is popular among professional traders, across many different asset classes and backtesting, for signalling market timing (exhaustion) to both the up and down side.
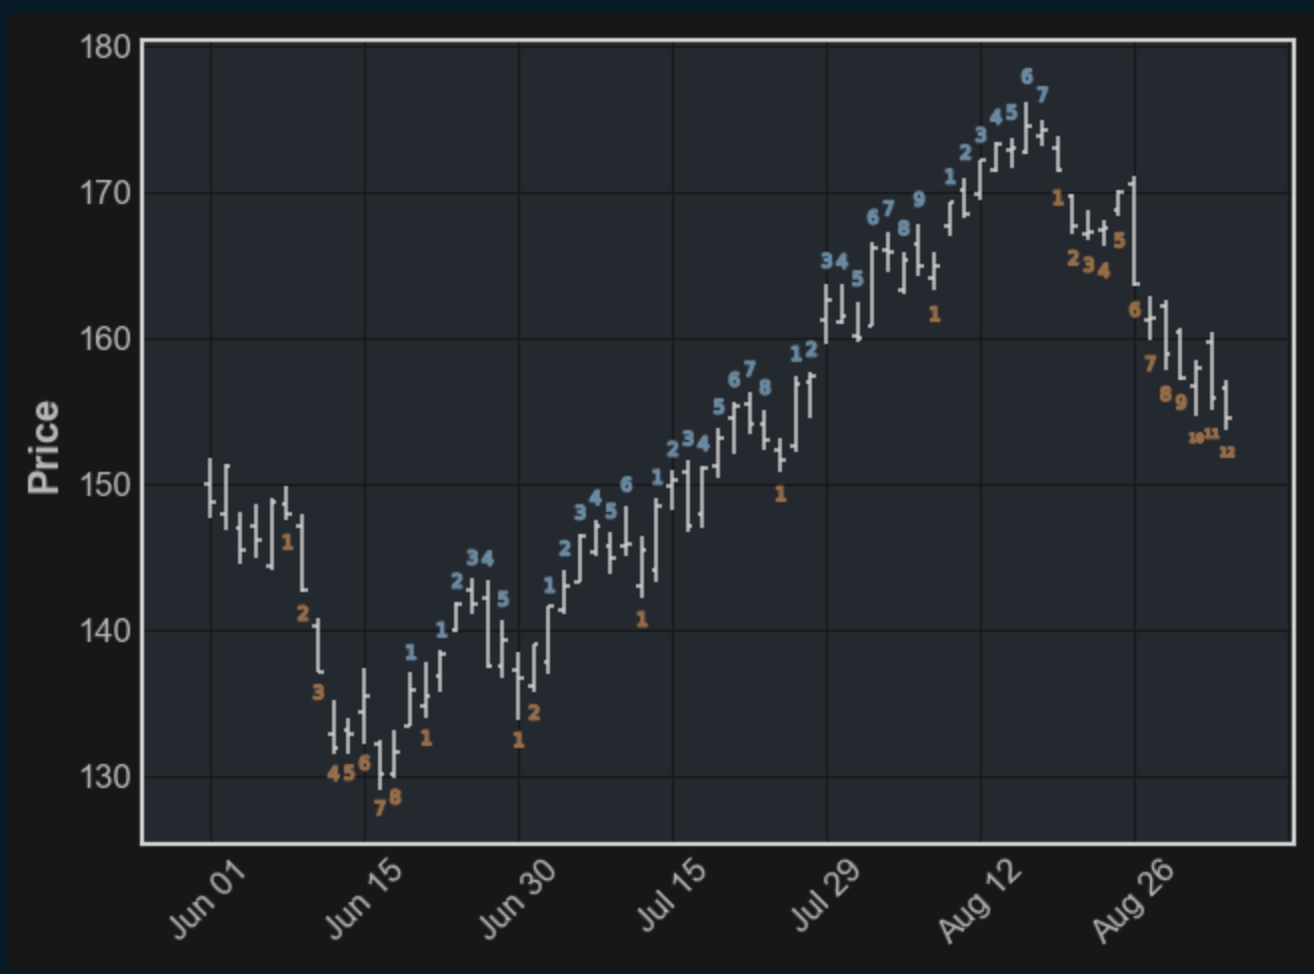
A Buy Setup occurs when there are 9 consecutive closes less than the close four bars earlier. A Sell Setup occurs when there are 9 consecutive closes greater than the close four bars earlier.

The Risk Level identifies the potential residual trend momentum once Countdown is completed. The Risk Level is often considered a secondary level of price exhaustion, not only defining the zone in which the market is primed for a reversal but also providing support/resistance to the chart.
When a Countdown series is completed a Risk Level is generated, identifying the zone within which there should be a reversal, as well as the amount of residual momentum the trend could experience and yet still preserve the buy or sell reading. The Risk Level associated with a completed Buy Countdown represents the price above which the 13 buy remains active, and serves as support on weakness; conversely, the Risk Level associated with a completed Sell Countdown represents the price below which the 13 sell remains active, and serves as resistance on strength. It is helpful to think of this level as the maximum threshold that the price exhaustion series can withstand before the momentum overwhelms the signal and renders it ineffective.
As with many other DeMARK Indicators, the qualified and disqualified Breakout Rules apply to help gauge whether or not the Sequential signal remains intact.

The twelve price bar metric states that a reversal should occur within 12 bars of a completed 13. If the chart has not responded in that time the 13 is unlikely to have the desired response, and the existing trend is likely to continue.

Adding this component to our technical analysis functions will provide users with an open source alternative to a popular proprietary indicator. This would also be an excellent tool for the Forecast Menu (@martinb-bb) to include.
What are your thoughts on how this looks? WIth mplfinance, it gets kinda tricky to add on text, let alone text that is readable.
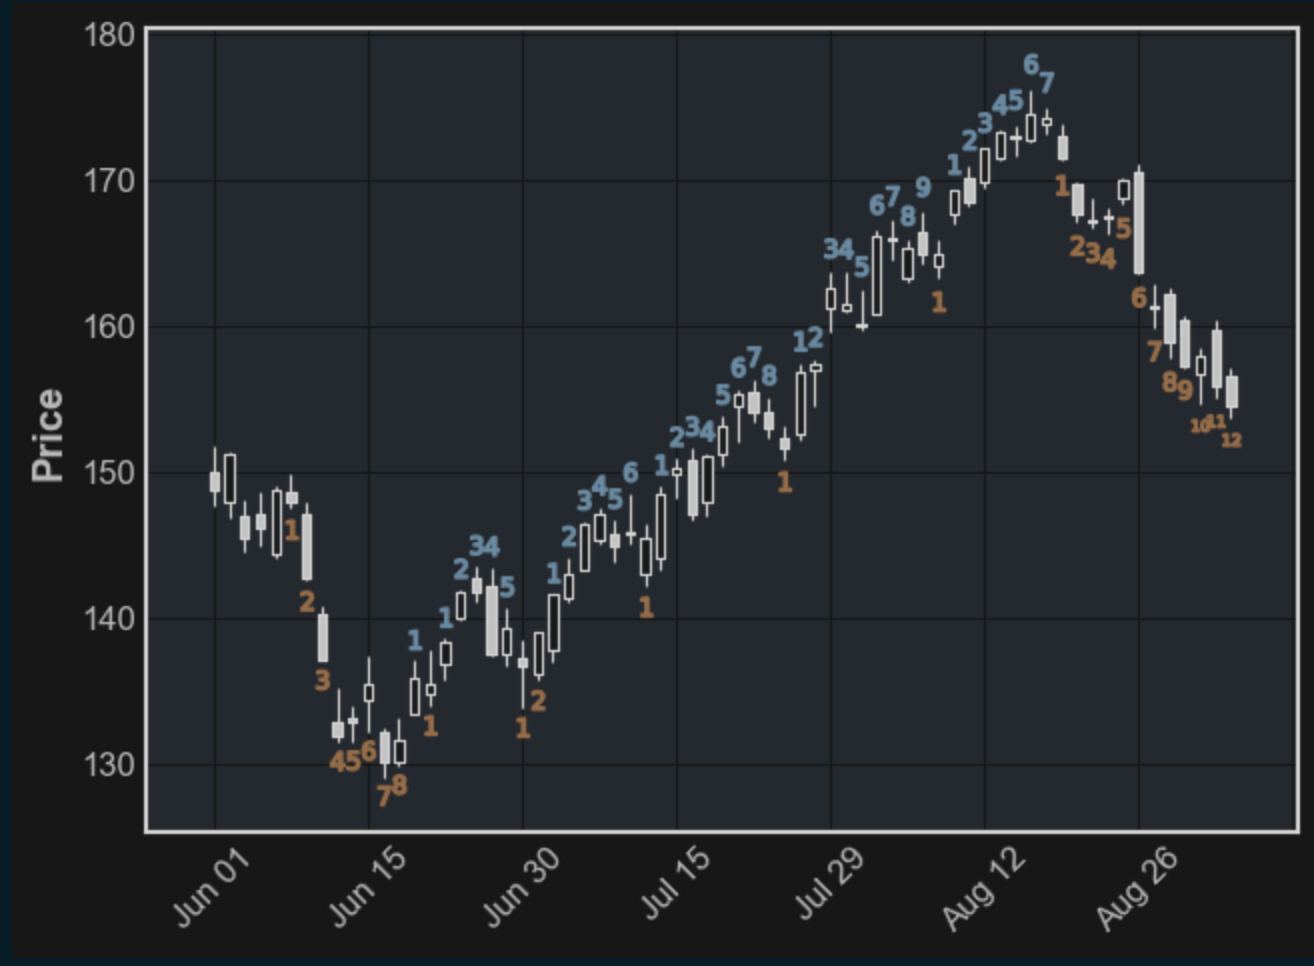
I just love that I'm looking at this! It's legible, although a bit crowded. Perhaps is suited for the type of candle that is in the example pictures, which can reduce visual clutter. The numbers look like bold text, or at least thicker than they need to be. Perhaps reducing the font size by two points will help reduce crowding?
Do the exhaustion point directional arrows, and support/resistance lines, come as part of the built-in function? What are the arguments that are built in?
Do the exhaustion point directional arrows, and support/resistance lines, come as part of the built-in function? What are the arguments that are built in?
Negative. It just gives a dataframe for Up and Down with values 1-13.
td_seq(close, asint=None, offset=None, **kwargs)
    TD Sequential (TD_SEQ)

    Tom DeMark's Sequential indicator attempts to identify a price point where an
    uptrend or a downtrend exhausts itself and reverses.

    Sources:
        https://tradetrekker.wordpress.com/tdsequential/

    Calculation:
        Compare current close price with 4 days ago price, up to 13 days. For the
        consecutive ascending or descending price sequence, display 6th to 9th day
        value.

    Args:
        close (pd.Series): Series of 'close's
        asint (bool): If True, fillnas with 0 and change type to int. Default: False
        offset (int): How many periods to offset the result. Default: 0

    Kwargs:
        show_all (bool): Show 1 - 13. If set to False, show 6 - 9. Default: True
        fillna (value, optional): pd.DataFrame.fillna(value)

    Returns:
        pd.DataFrame: New feature generat
the show_all kwarg is notable, and should be an optional argument, --69? some people may find a purpose for offset, otherwise doesn't look like there is much to muck around with.
does it care about the resolution of the interval? weekly, monthly, hourly?
ummmm. I think I deleted my playground notebook. But this should be an easy add once I am sitting down and just hammering out the eature.
Is it possible to develop this into a dashboard view of various assets on multiple timeframes?