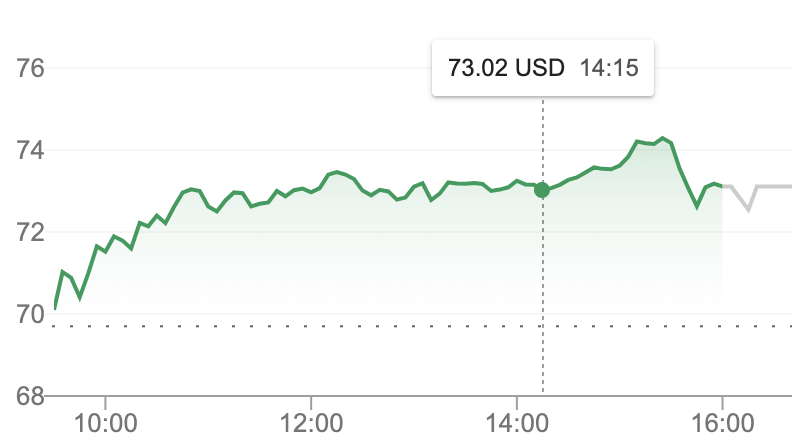
Popup in charts
We should have a way to obtain contextual information using the mouse. Here is a hacky way of doing it:
x := -3.14 to: 3.14 by: 0.4.
y := x sin.

c := RSChart new.
c addPlot: (RSBarPlot new y: y).
c addDecoration: (RSChartTitleDecoration new title: 'Sin function'; fontSize: 20).
c build.

(c canvas shapes select: [ :s | s model notNil and: [ s class == RSBox ] ]) @ RSPopup.

c canvas.
What kind of popup do we need?
line popup
a popup that can add other shapes as visual guide

There is a new class called RSPopupDecoration
This decoration uses RSPopupChart a subclass of RSPopup. This popup uses 2 shape builders, one to build the popup builder and other to build the marker line.
Consider
| x cumsum c  y error popup |
x := 1 to: 100.
cumsum := [:arr | | sum |
	sum := 0.
	arr collect: [ :v | sum := sum + v. sum ] ].

c := RSChart new.
c extent: 800@400.

popup := RSPopupDecoration new.
c addDecoration: popup.

#(
series1 red
series2 blue) pairsDo: [ :label :color |
	| col plot |
	y := (x collect: [ :i | 50 atRandom - 25 ]).
	y := cumsum value: y.
	error := x.
	col := color value: Color.

	c addPlot: (RSAreaPlot new
		x: x y1: y + error y2: y - error;
		color: col translucent).
	c addPlot: (plot := RSLinePlot new x: x y: y; fmt: 'o';
		color: col;
		yourself).
	popup chartPopupBuilder
		for: plot text: label color: col.
	 ].

c build.

^ c canvas.
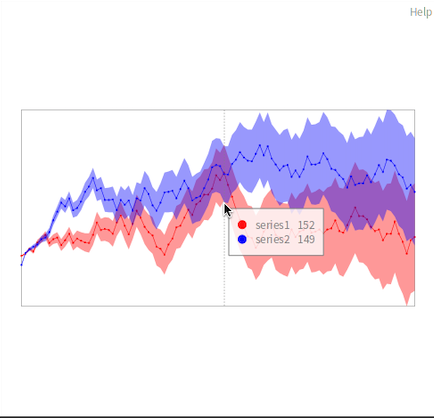
For some reason it seems it does not work with Float / Fraction x value?
The popup will only show at some portion of the chart (mostly the left/beginning), and the value does not correspond to the (closest data) point under cursor.
I am very new to Pharo, so I couldn't dig up more specific/deeper info yet.
| x cumsum c  y error popup |

x := 1 to: 100 count:20.
"(x := 1 to: 100 count:20) collect: [:v| v asFloat] ." "or this, also doesn't work"

cumsum := [:arr | | sum |
	sum := 0.
	arr collect: [ :v | sum := sum + v. sum ] ].

c := RSChart new.
c extent: 800@400.

popup := RSPopupDecoration new.
c addDecoration: popup.

#(
series1 red
series2 blue) pairsDo: [ :label :color |
	| col plot |
	y := (x collect: [ :i | 50 atRandom - 25 ]).
	y := cumsum value: y.
	error := x.
	col := color value: Color.

	c addPlot: (RSAreaPlot new
		x: x y1: y + error y2: y - error;
		color: col translucent).
	c addPlot: (plot := RSLinePlot new x: x y: y; fmt: 'o';
		color: col;
		yourself).
	popup chartPopupBuilder
		for: plot text: label color: col.
	 ].

c build.

^ c canvas.
I think I found sth,
in RSLineChartPopupBuilder >> valuePointFor:
there is some strange play with the xValue and index
particularly xValue got rounded to 1,
and then it got reassigned by [xValue := index] ?
valuePointFor: aRSLinePlot
	| xValue yValue index |
	xValue := (aRSLinePlot xScale invert: position x) roundTo: 1.
	index := aRSLinePlot xValues indexOf: xValue.
	index = 0 ifFalse: [ xValue := index ].
	(xValue between: 1 and: aRSLinePlot yValues size)
		ifFalse: [ ^ nil ].
	yValue := aRSLinePlot yValues at: xValue.
	^ xValue @ yValue
got something working:
valuePointFor: aRSLinePlot
	| xValue yValue index idxLo idxHi |

	"get domain value from pixel location"
	xValue := (aRSLinePlot xScale invert: position x).
	"find closest (larger end) index pair that enclose xValue"
	idxLo := [ | i |
		i := (aRSLinePlot xValues findLast: [:v| v <= xValue]).
		i > 0 ifTrue: [i] ifFalse: [ ^ nil ]
	] value.
	idxHi := (idxLo + 1) <= aRSLinePlot xValues size
		ifTrue: [idxLo + 1]
		ifFalse: [ ^ nil ].

	index :=
		((aRSLinePlot xValues at: idxHi) - xValue) abs <=
		((aRSLinePlot xValues at: idxLo) - xValue) abs
		ifTrue: [ idxHi ] ifFalse: [ idxLo ].

	"return nil if index is out of bound of yValues"
	(index between: 1 and: aRSLinePlot yValues size) ifFalse: [ ^ nil ].

	yValue := aRSLinePlot yValues at: index.

	^ xValue @ yValue
This change will affect RSChartExample>>#example22CustomPopup,
its ln:64 need to be changed
from: date := RSLabel new text: (names at: point x).
to: date := RSLabel new text: (names at: (point x roundTo: 1)).
which, I think make sense.
any comments will be appreciated.
Hello @x-EricH-x, inded this popup was thinking to work with integer values, It does not work with float values. I will reopen the issue