RiskAssessmentFramework
 RiskAssessmentFramework copied to clipboard
Not analyzing
Hello I try to scan an existing project but it can not analyze.
INFO: Load project settings for component key: '5cc5a81df8f52d06ad7a5298aeb5ea2b' INFO: Load project settings for component key: '5cc5a81df8f52d06ad7a5298aeb5ea2b' (done) | time=82ms INFO: Load quality profiles INFO: Load quality profiles (done) | time=129ms INFO: Load active rules INFO: Load active rules (done) | time=2490ms INFO: Indexing files... INFO: Project configuration: INFO: 1 file indexed INFO: 0 files ignored because of scm ignore settings INFO: ------------- Run sensors on module 5cc5a81df8f52d06ad7a5298aeb5ea2b INFO: Load metrics repository INFO: Load metrics repository (done) | time=49ms INFO: Sensor JaCoCo XML Report Importer [jacoco] INFO: Sensor JaCoCo XML Report Importer [jacoco] (done) | time=3ms INFO: Sensor JavaXmlSensor [java] INFO: Sensor JavaXmlSensor [java] (done) | time=1ms INFO: Sensor HTML [web] INFO: Sensor HTML [web] (done) | time=4ms INFO: ------------- Run sensors on project INFO: Sensor Zero Coverage Sensor INFO: Sensor Zero Coverage Sensor (done) | time=2ms INFO: CPD Executor Calculating CPD for 0 files INFO: CPD Executor CPD calculation finished (done) | time=0ms INFO: Analysis report generated in 684ms, dir size=74 KB INFO: Analysis report compressed in 80ms, zip size=9 KB INFO: Analysis report uploaded in 65ms INFO: ANALYSIS SUCCESSFUL, you can browse http://localhost:9000/dashboard?id=5cc5a81df8f52d06ad7a5298aeb5ea2b INFO: Note that you will be able to access the updated dashboard once the server has processed the submitted analysis report INFO: More about the report processing at http://localhost:9000/api/ce/task?id=AXED3w4aSbhJgxCN4yPY INFO: Analysis total time: 9.960 s INFO: ------------------------------------------------------------------------ INFO: EXECUTION SUCCESS INFO: ------------------------------------------------------------------------ INFO: Total time: 12.300s INFO: Final Memory: 12M/44M
It seems passed at SonarQube
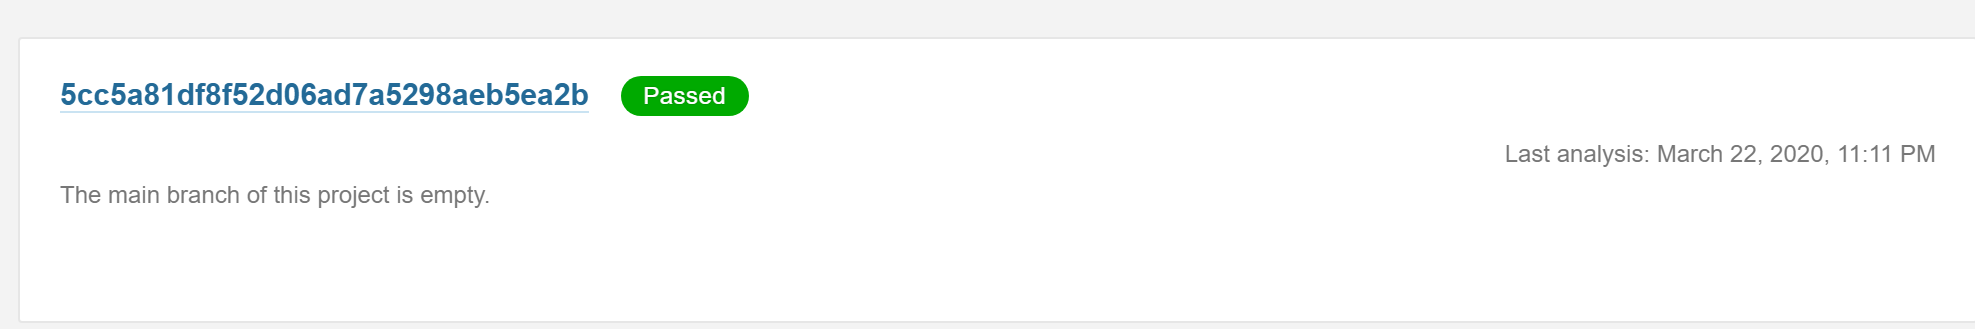
Language etc seems empty in SQL

The problem is i could scan it with SonarQube and it found some vulnerabilities.
What is wrong in my case? Thank you for your help.
Hi @ahmetkizilkaya, the problem is that you are not getting any results on the dashboard is it ?
@azharanees yes, there is no result on the dashboard.I tried different vulnerable applications too.
@azharanees I sent all console log before. What do you need, I try to regenerate.
@ahmetkizilkaya yeah please try regenerating the issue and if possible please send in the api logs