[BUG] Capacity Factor Calculation
Conda environment check
- [X] I have tried using the
osemosys-globalconda environment.
Current Behavior
Running the default configuration (4 seasons with 2 day parts) over BBIN shows no investment in solar and wind. Just looking at the wind and solar, my gut feeling is that the capacity factors seems a little low.
For example, over a single year with the default configuration, the average cf is 9.1% for onshore wind with quite a few individual time slices being less then 5%. Increasing the resolution (4 seasons with 8 day parts) showed minimal difference in the processed capacity factors, and no obvious difference in subsequent new capacity and generation results.
Expected Behavior
I would expect the default scenario wind capacity factor to be a little higher (~30% maybe). Moreover, the max capacity factors between the two scenarios changed a less then I expected. Default scenario max was 23.5% while increased resolution was 26.5%.
With that said, I am definitively not a wind power expert so maybe I am just overthinking this 🙃
Steps To Reproduce
- Copy over configuration file below
- Run the command
snakemake -c
Operating System
Linux
Log output
Here is the configuration file...

# High Level Configuration
inputDir: 'resources'
outputDir: 'results'
modelName: 'OsemosysGlobal'
region: 'GLOBAL'

# Scenario Name
scenario: 'bbin-default-ts'

# Temporal Parameters
startYear: 2020
endYear: 2040
daytype: False
dayparts:
  #daypart : [start_hour (inclusive), end_hour (exclusive)]
  D1: [0, 12]
  D2: [12, 24]
seasons:
  #season : [month 1, month 2, ...] (all inclusive)
  S1: [12, 1, 2]
  S2: [3, 4, 5]
  S3: [6, 7, 8]
  S4: [9, 10, 11]

# Spatial Parameters
geographic_scope:
  - 'IND'
  - 'BGD'
  - 'BTN'
  - 'NPL'
crossborderTrade: True

# Emission Parameters
emission_penalty: 50 # M$/MT CO2

# Investment Parameters
no_invest_technologies:
  - 'GEO'
  - 'CSP'
  - 'WAV'
  - 'BIO'

# Result Parameters
results_by_country: True
Anything else?
I looked at the capacity factor calculation, and it seems to be executing correctly (ie. no coding bug). But there was a part I was a little confused by....
https://github.com/OSeMOSYS/osemosys_global/blob/70f7f5cd7f60149a795f29dc95a94f6ba767027c/workflow/scripts/osemosys_global/OPG_TS_data.py#L383-L391
For all renewable capacity factors (spv, csp, won, wof, hyd) we take the mean based on timeslice and node which makes sense. But then we divide by 100 and I'm not sure where that is coming from? Like dividing by 100 would only make sense if the values were in percentage form, or if the generation profiles are MW values from an 100MW facility? But I don't think either of those situations are the case? Looking at the PLEXOS World wind adjusted profiles (item 11), some of the values are over 100 after the adjustment which I would take to mean aren't a percentage? But I may just be misunderstanding how the adjustment works? :)
Also, to go from the PLEXOS World adjusted profiles to our input files for wind and solar, some aggregation processing happens. As the PLEXOS world dataset is defined over each station, while our input (Won 2015.csv) is defined over nodes? But I don't know where that processing happens to help me figure out units and whatnot?
I don't think anyone ever got assigned to look at capacity factors during our data audit 😅 so I am more just looking for a second opinion on if the capacity factors seem low to help me narrow down the issue ! Thanks so much !
Hi @trevorb1, my comments on this;
-
First, in general indeed CFs for solar/wind (not hydro since that is a more mature technology) are lower than we can expect for future years in e.g. 2050 due to a combination of technological learning and the use of currently untapped locations with high capacity factors. The values we use are benchmarked at 2015 values at the country level so indeed they are on the low end. This is something we need to address, but unfortunately easier said than done because possible CF improvements compared to current day standards are very contextual. Easiest (but not most accurate) would be to apply a standard proportional increase in CFs per technology for all nodes. Scaling of CF timeseries is complicated though because values can reach >100% if you apply scaling linearly. Non-linear scaling to stay within the 100% boundary would become an optimization problem. PLEXOS has a tool that can do this but not sure if we want to use that. A more accurate but also more complicated alternative (computationally and model structure) would be to include a range of wind/solar technologies in the expansion with incremental CF bands (this is how IAMs like MESSAGE/REMIND generally do it). Datasets exist with country level wind/solar potentials per CF band. We should probably start a new issue (if it doesn't exist already) to address this...
-
Second, even though the CFs are low, the BBIN example for wind is extreme but CFs of +- 10% can be expected following CF values as shown in e.g. https://globalwindatlas.info/. PV CFs for India don't seem unreasonable (note that D2 are near 0 due to the fact that all input data is in CET so that's mostly nighttime locally in India).
GLOBAL | PWRSPVINDEA01 | S1D1 | 2049 | 0.2349 GLOBAL | PWRSPVINDNE01 | S1D1 | 2049 | 0.23 GLOBAL | PWRSPVINDNO01 | S1D1 | 2049 | 0.2508 GLOBAL | PWRSPVINDSO01 | S1D1 | 2049 | 0.2549 GLOBAL | PWRSPVINDWE01 | S1D1 | 2049 | 0.2619 GLOBAL | PWRSPVINDEA01 | S1D2 | 2049 | 0.0001 GLOBAL | PWRSPVINDNE01 | S1D2 | 2049 | 0.0001 GLOBAL | PWRSPVINDNO01 | S1D2 | 2049 | 0.0013 GLOBAL | PWRSPVINDSO01 | S1D2 | 2049 | 0.0005 GLOBAL | PWRSPVINDWE01 | S1D2 | 2049 | 0.0018
-
Regarding the values they are in % indeed and hence divided by 100. Note that the timeseries files we use (e.g. Won 2015.csv) with e.g. column 'IND-EA' is the exact same as 'IND-EA_Win_Capacity Scaler' in item 11 on the Harvard Dataverse. The aggregation from station level to aggregated nodal level profiles is something i've done in the past by means of a capacity weighted average as such that larger wind/solar projects have a larger role in the final nodal level timeseries.
-
So long story short, I agree that CFs based on the current input data are low but to me the calculations in the script make sense (no bug I think). @trevorb1 could you do a run with increased CFs as a test to see if it makes a differences? E.g. just add a temporary line in the script that increase wind/solar CFs by 30% or so? If it shows a significant difference we could think about integrating timeseries with higher CFs but will probably have to discuss that in person @abhishek0208 @tniet?
Hey @maartenbrinkerink, thanks for the detailed answer ! Definitively helps clear up some of my confusion !
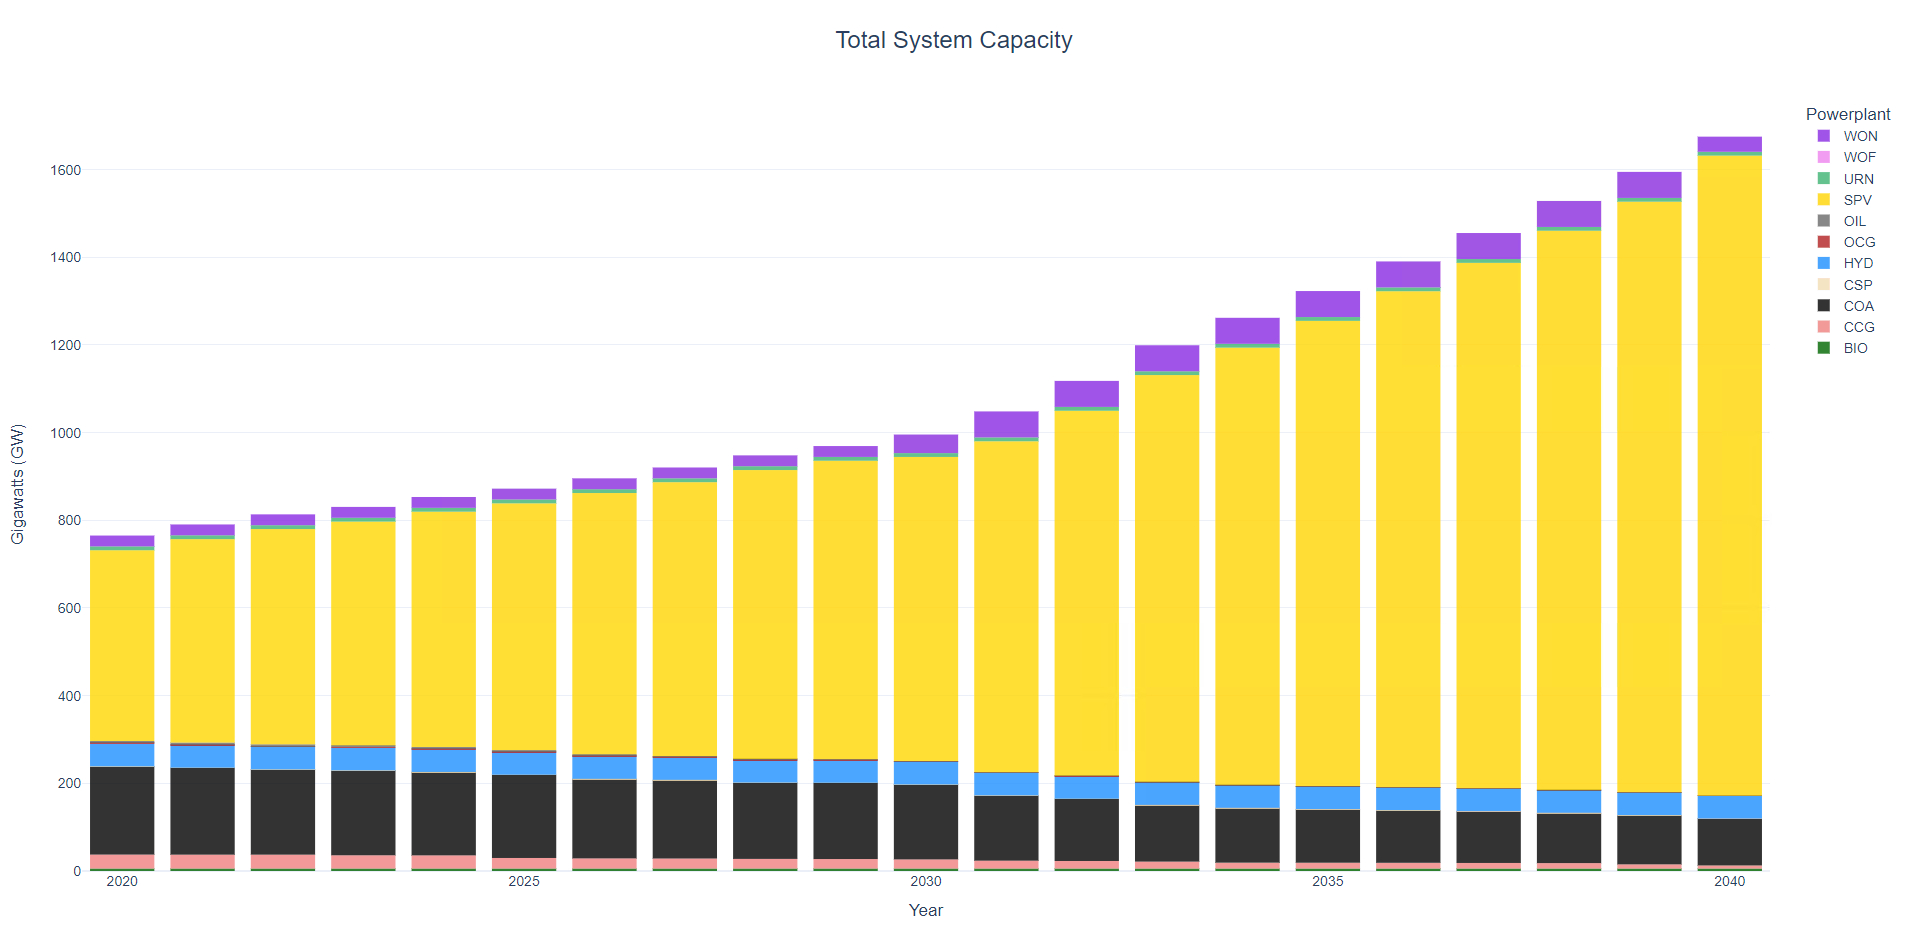
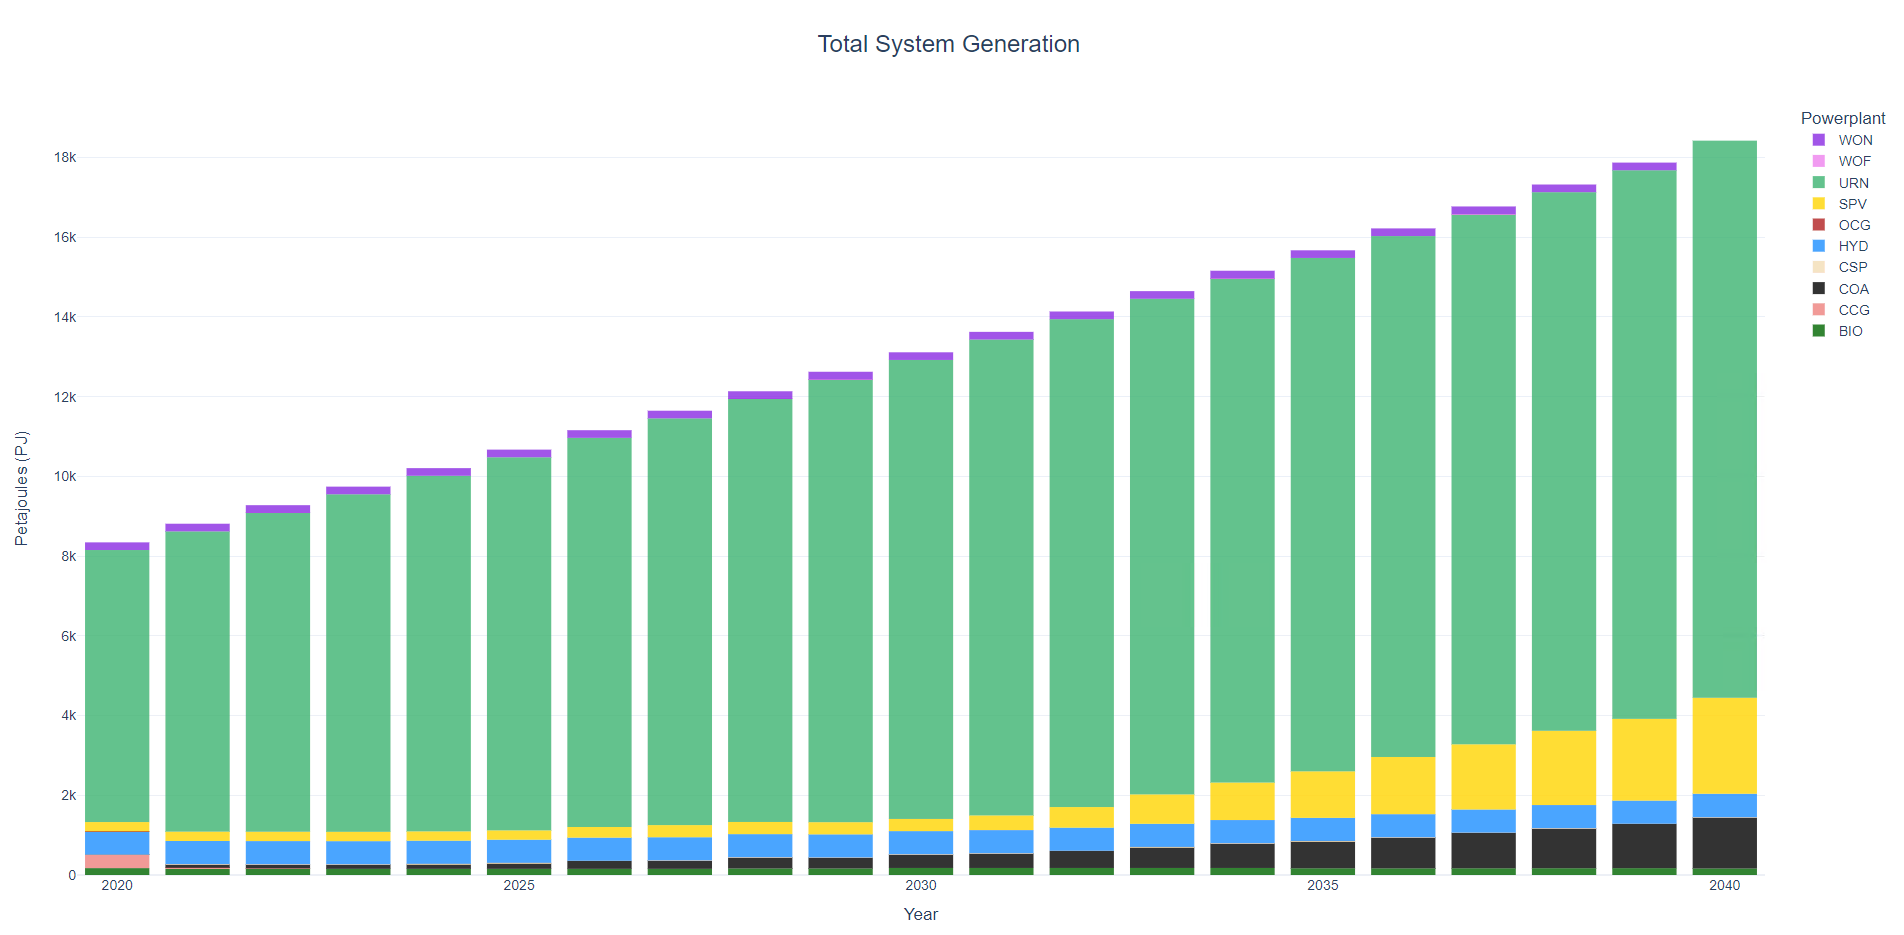
I reran with updated capacity factors, as you suggested, increasing SPV, WON, and WOF by a flat 30% for every time slice. In the 30% cf increase results shown below, SPV cfs are between 30% and 64%, WON cfs are between 31% and 53%, and WOF (only available in three regions) are between 39% and 58%.
Increasing the capacity factor by 30% basically switched all investment from nuclear to solar with a little wind. I also reran with 10% and 20% capacity factor increases. For the 20% increase, the results looked similar to the 30% increase with nuclear basically being replaced by wind and solar. However, wind had an increased share of capacity. The 10% increased showed results closer to the default configuration scenario, with some additional solar investment. These results are also attached below.
Since the capacity factor seems to be a source of sensitivity, I would be into implementing one of your suggestions? But I agree, might be better for an in person discussion on how to address this.
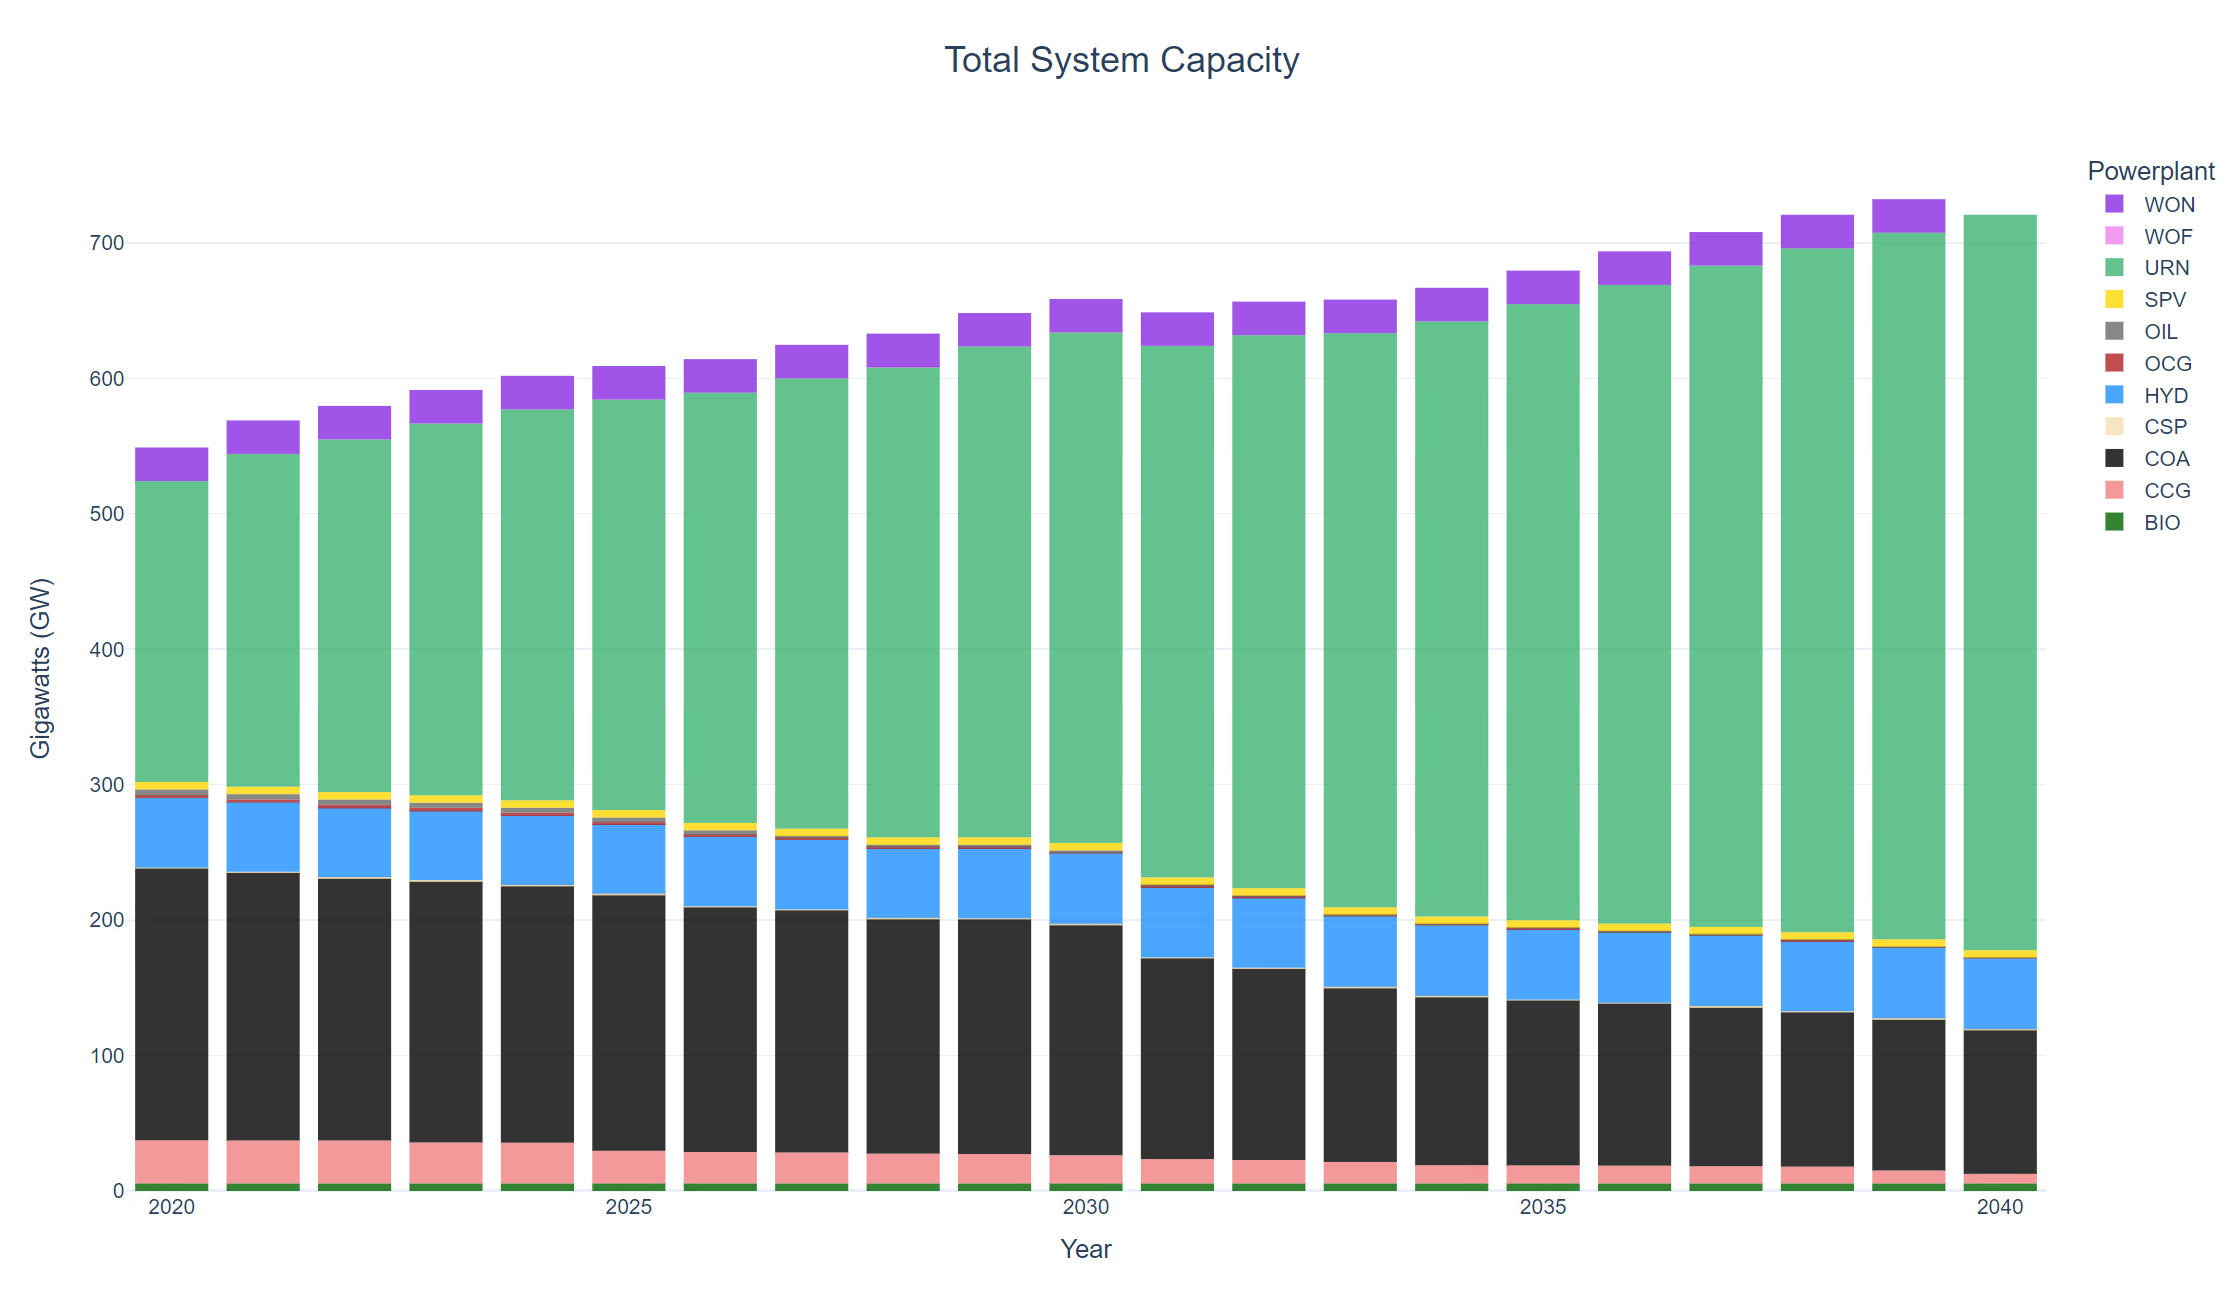
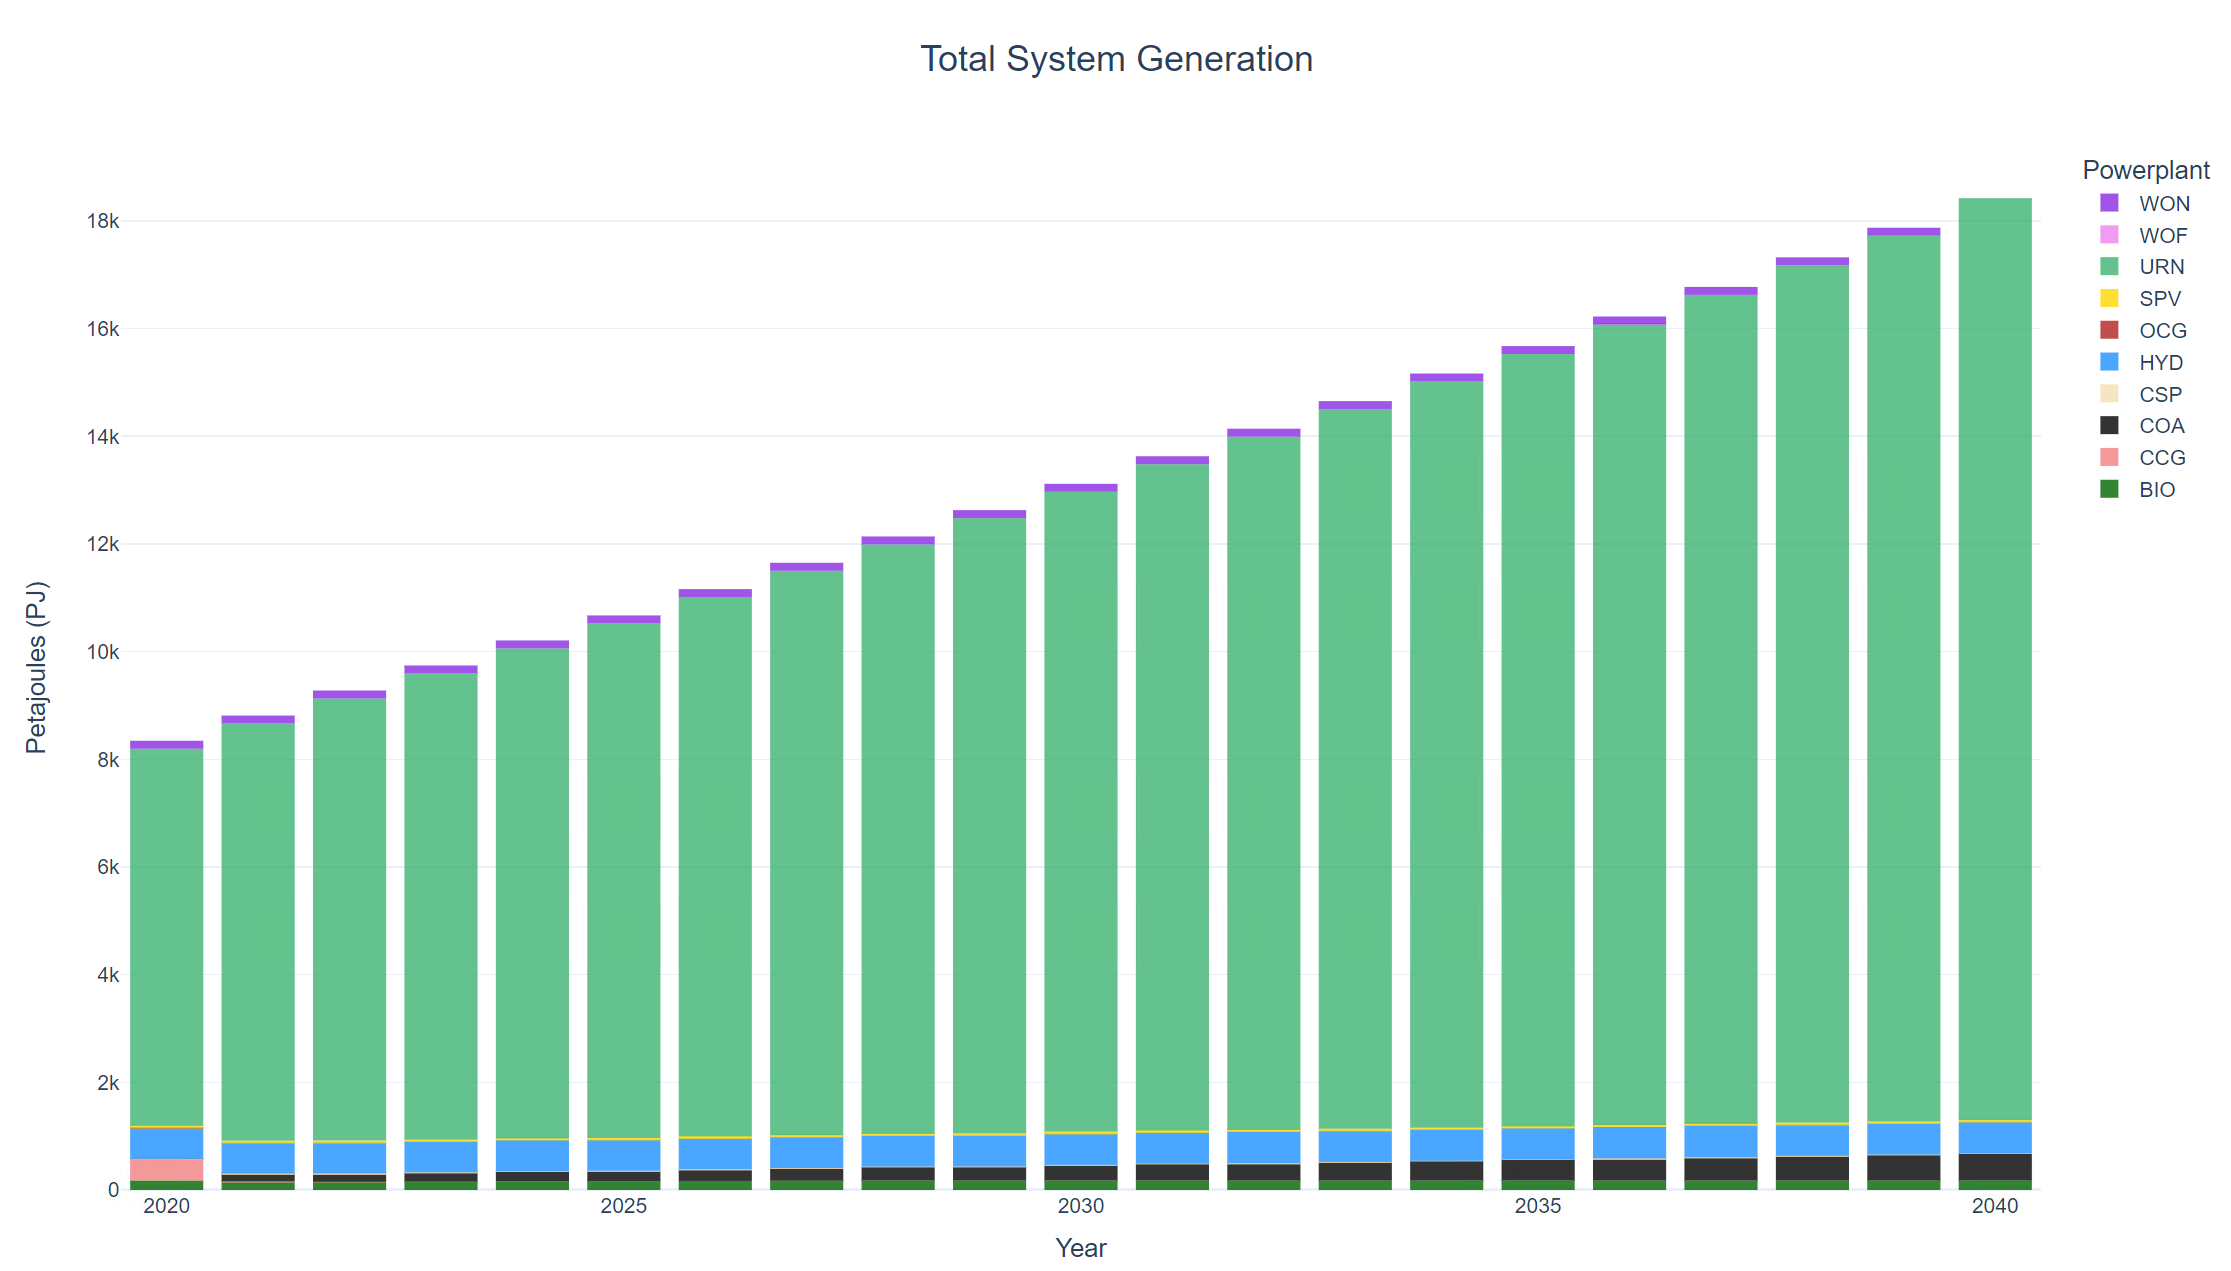
ORIGINAL RESULTS
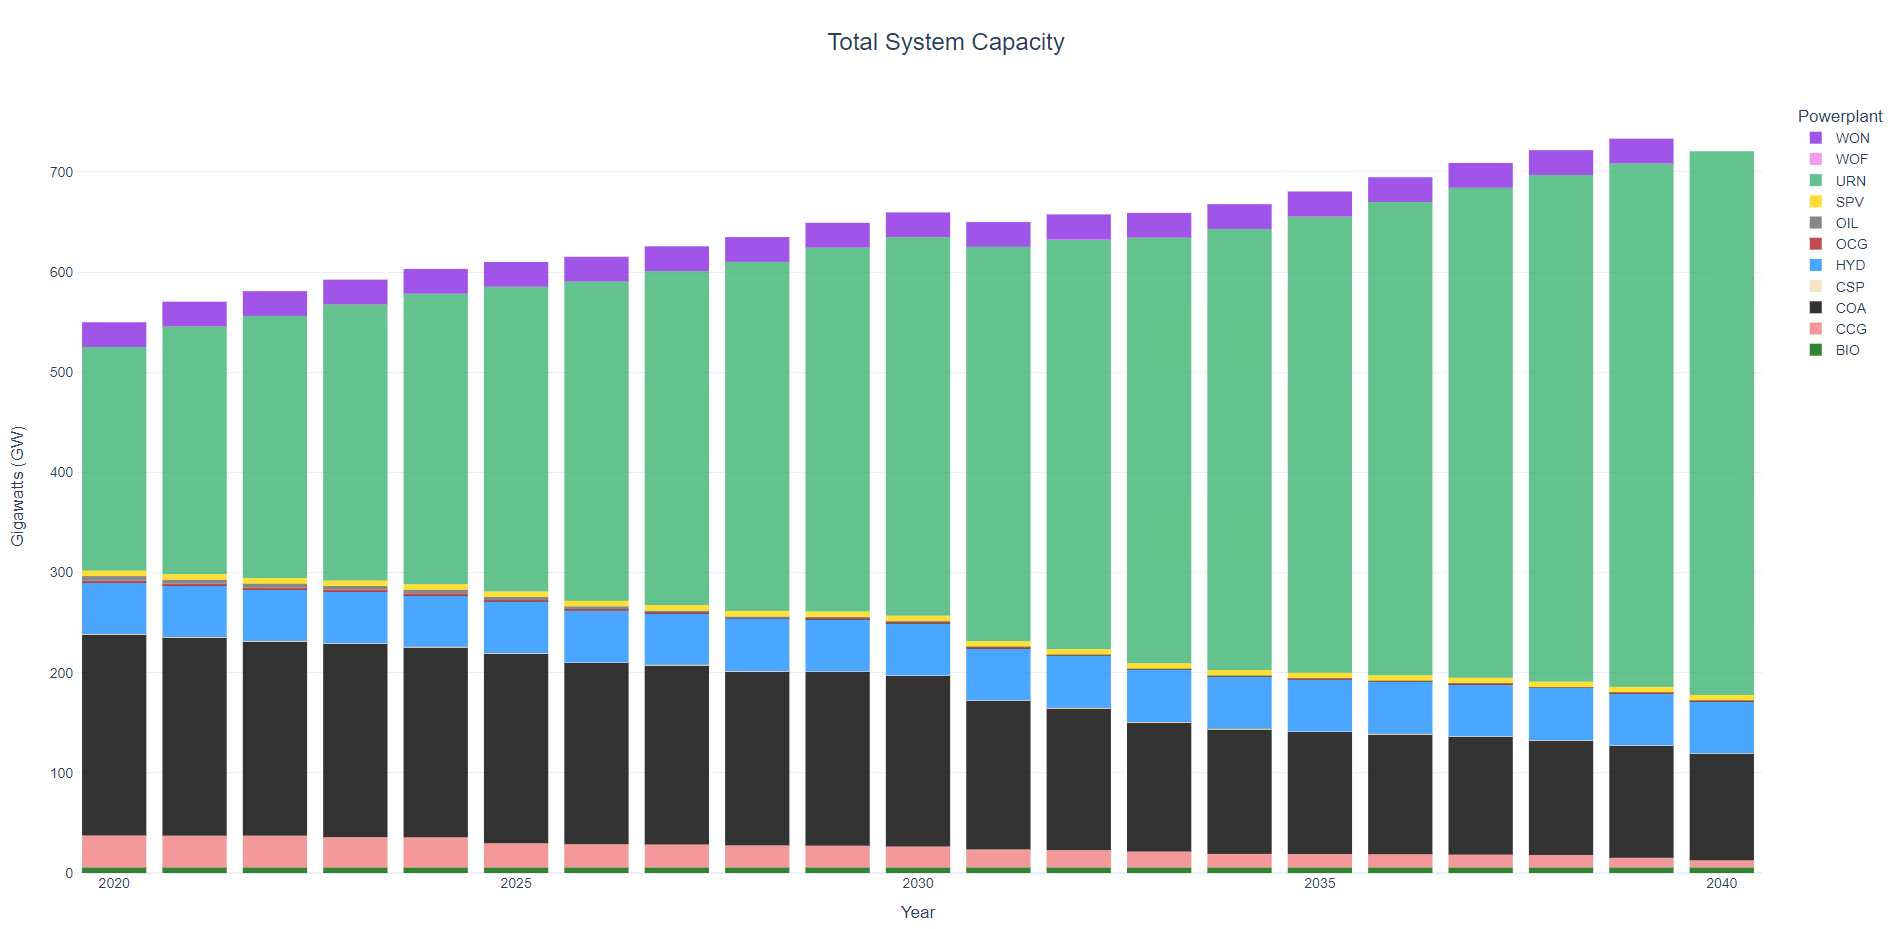
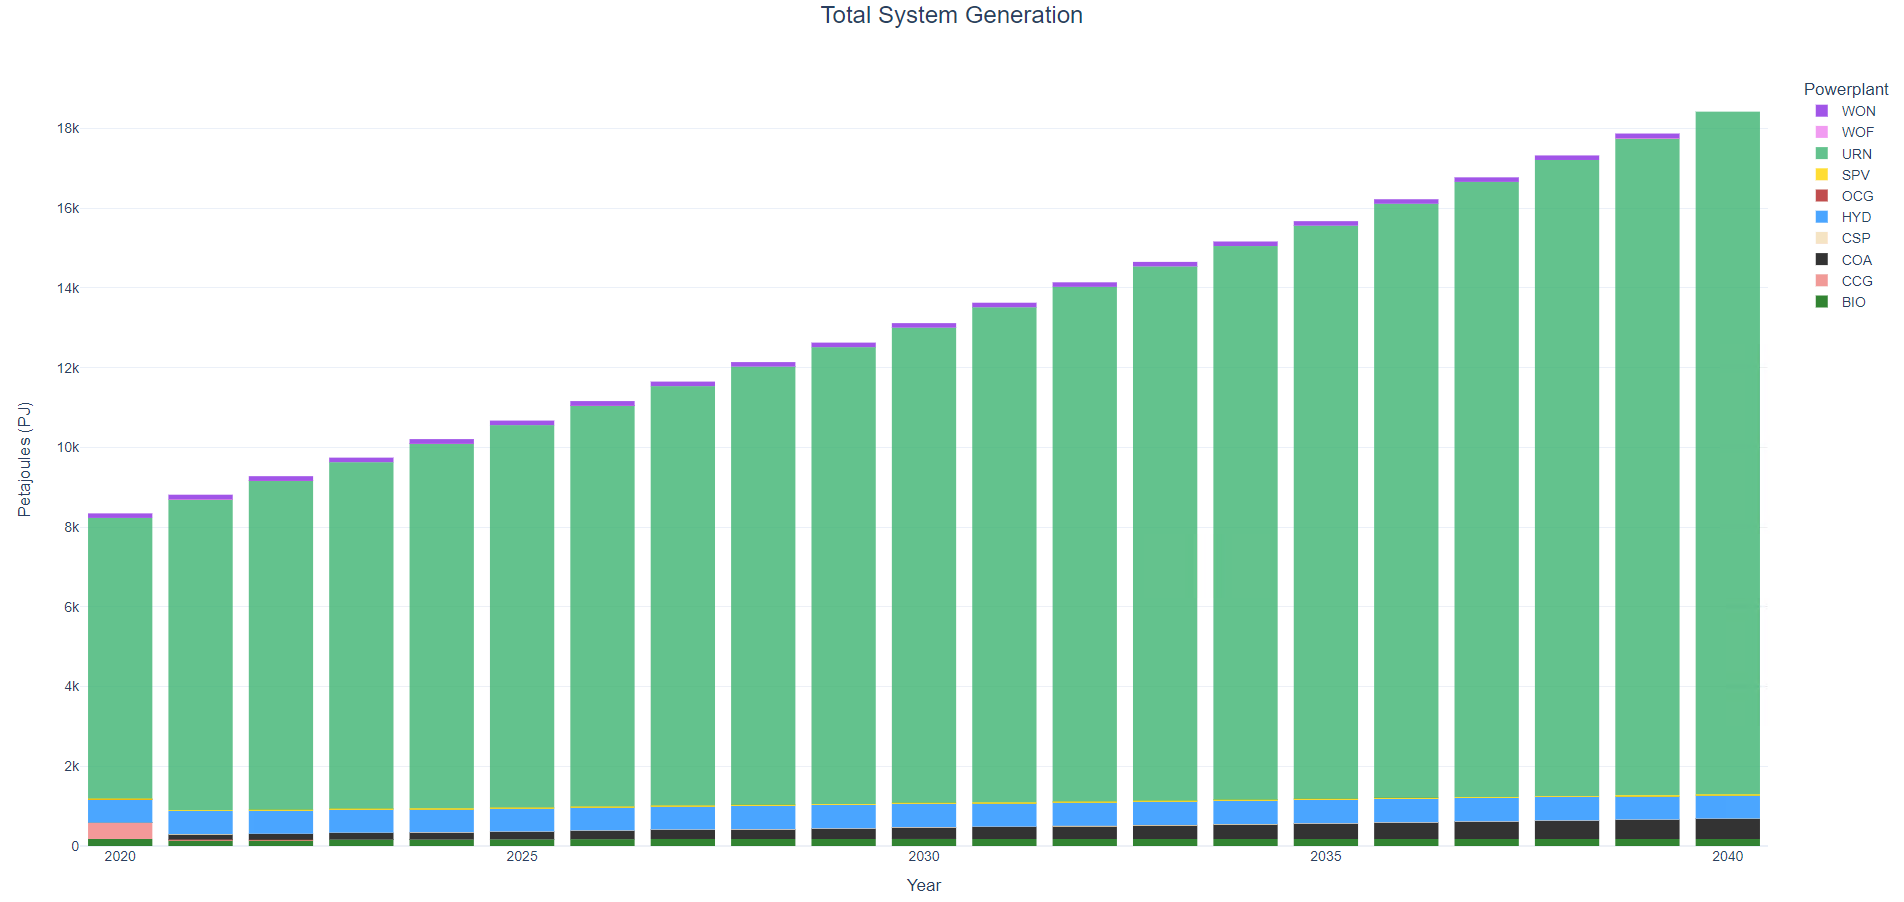
30% CAPACITY FACTOR INCREASE RESULTS

20% CAPACITY FACTOR INCREASE RESULTS


10% CAPACITY FACTOR INCREASE RESULTS

Hi Trevor,
What I meant was a relative 30% increase so e.g. 12% * 1.3 would become 15.6% etc. With a flat 30% SPV would have a CF of 30% during the night hours as well I assume so it makes sense that it is being picked up a lot more. That said, your exercise shows what we wanted to know really, CFs are very relevant so its worth discussing how (and when) to address this. I can’t fully recall everyone’s schedule but I’m flexible next week.
Cheers, Maarten
oh my goodness, adding a relative 30% of course makes way more sense then just straight adding 30% haha. Updated results for that are down below ! Basically the same as the default scenario. But idk if this still seems weird that we are seeing minimal/no wind and solar investment for fairly coarse timeslicing? I will start an email thread to see if we want to meet up to discuss in person. Thanks, @maartenbrinkerink !
30% RELATIVE CAPACITY FACTOR INCREASE
(ie. WON cf range went from 1.13->23.5% to 1.47->30.56%)
@maartenbrinkerink cant recall either. I will take a look later this week though. Thanks for flagging! :)
@trevorb1, @maartenbrinkerink Can we look at a few specific locations where we know the CF and what it should be? For India above, Maarten found reasonable numbers for solar. Question is if this is an input data issue (bad numbers or low factors in the input data) or a processing issue.
Also, what is the original source for the data - existing wind and solar installations or 'predicted' by something like the global wind atlas?