ResInsight
 ResInsight copied to clipboard
Published
20 hours ago •
 OPM
OPM
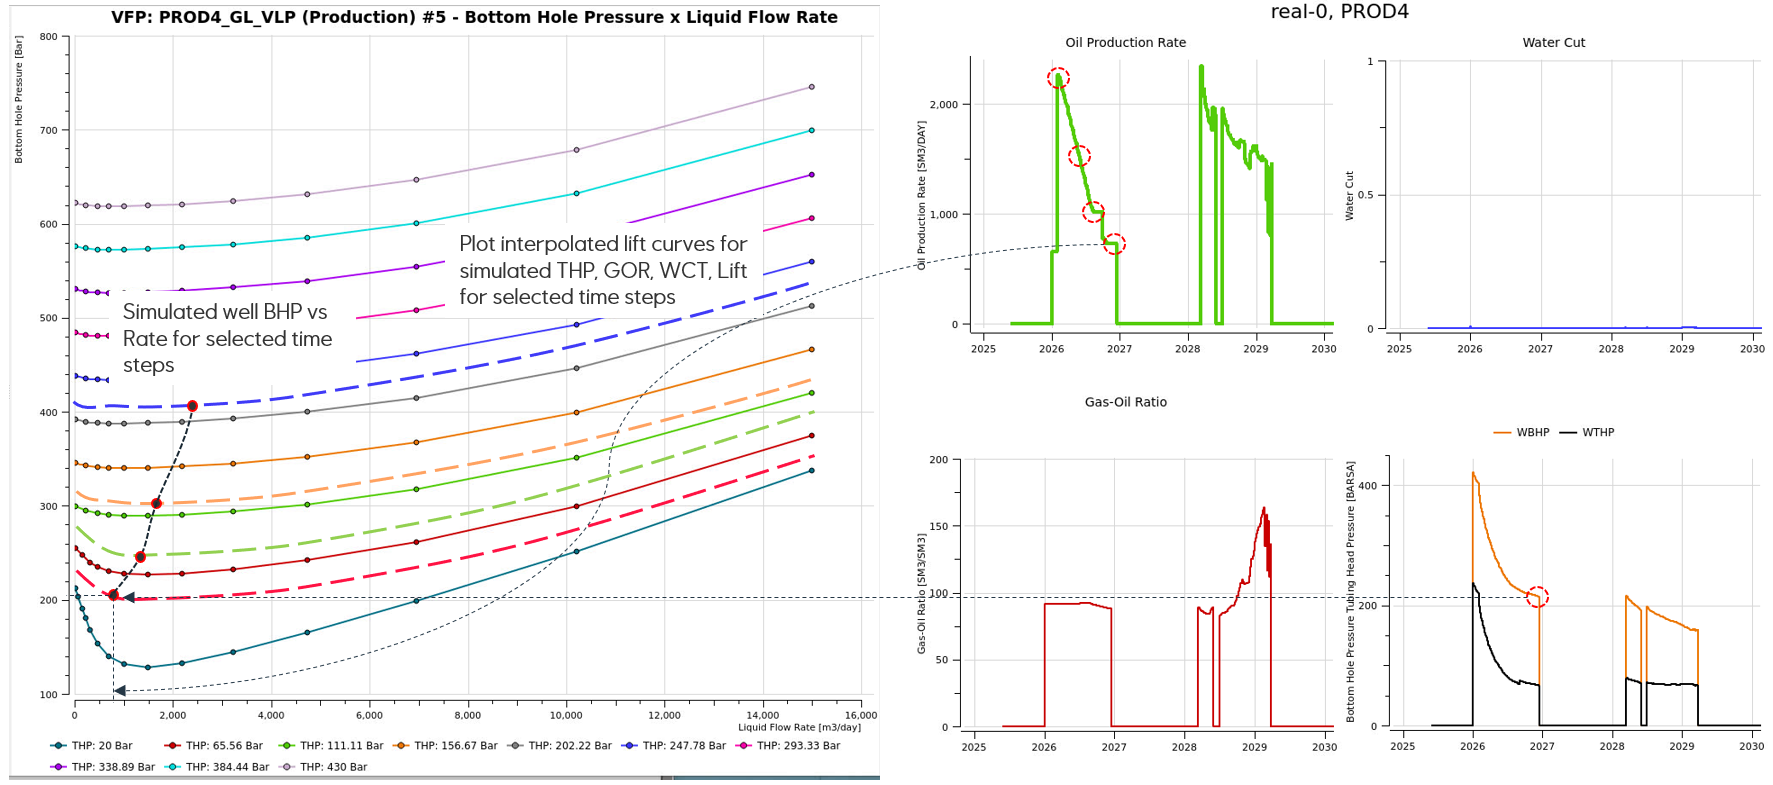
VFP plot: Analysis of simulated production performance
Allow user to investigate VFP curves at simulated well or group conditions to identify challenge with lift performance.
Plot WBHP vs well rate (liquid, oil, water, gas) at given time steps. Select points by right-click in summary plot to Create or add points. Plot interpolated lift curves for simulated time steps based on THP, GOR, WCT, Lift (by user option) Add option to turn off single or all table curves.
Would also be possible to add a Productivity Index ("PI") curve option as another type of plot, and have the PI curve move through time, together with the solution marked as a symbol?