ODM2DataSharingPortal
 ODM2DataSharingPortal copied to clipboard
Plotting threshold function (option to exclude data over/under a user-defined value(s) so that spikes and other out-of-water artifacts don’t crowd visualization)
Being able to exclude data over/under user-defined threshold will allow summary stats to be more accurate - e.g., removing -9999 data points is important for getting accurate data summaries
This has been an annoyance for me as well.
I would ask that any post processing "filtering" be clearly visible and a visible option to enable/disable the threshold exclusions.
I would hope that the threshold processing is either defaulted OFF, or is configurable per graph/per node.
Another aspect of this would be to exclude all data before a certain date, that way any initial "testing and configuration" of the node could be excluded once it goes into production.
The -9999 is intrusive, and is scattered through out ModularSensors as a magic number, and generally indicates the sensor is out-of-service.
I have on some sensors implemented an alternate value so that it isn't as intrusive, and can still indicate a malfunction.
Ideally the sensor status would be communicated out-of-band from the measurement stream, however this is beyond the current architecture of MMW.
Well a bit of interesting synchronicity, a -9999 reading came up this morning, and as a default was so clear that I got a call about it.
A question, If it hadn't been clear with the -9999 by default, would the user/owner of the gauge be able to determine something was wrong?
There was a visit to a site yesterday to replace an LT500 sensor by a TU hydrologist, however the person doing it didn't know that they had to configured the SDI-12 as part of the sensor. They where part of different crew than the person who orginally installed the sensor.
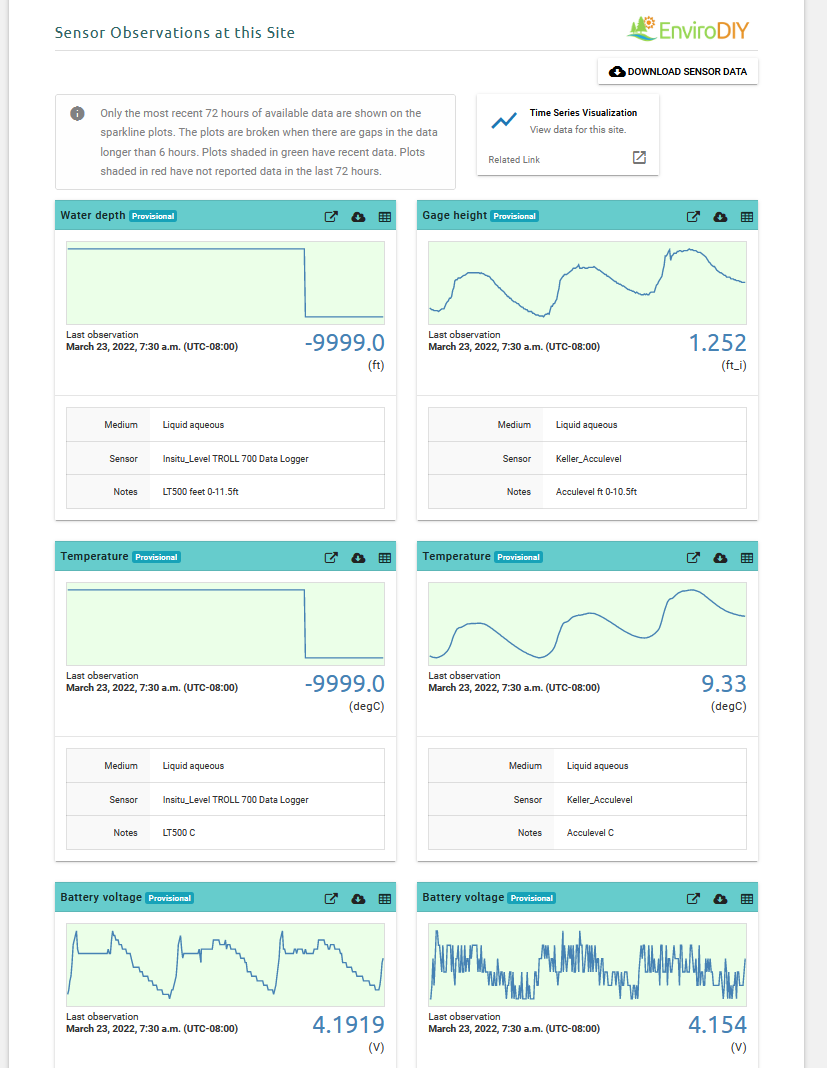
https://monitormywatershed.org/sites/TUCA-Na13/
This site has an LT500/SDI-12 and Keller Acculevel/Modbus
The site front page TSV sparkline report for the LT500 Water Depth and Water Temperature shows the LT500 reporting -9999 and the person doing the replace gave me a call about it. That is the -9999 is so distinctive, that it was clear that something was wrong.
The Acculevel is reporting normally.
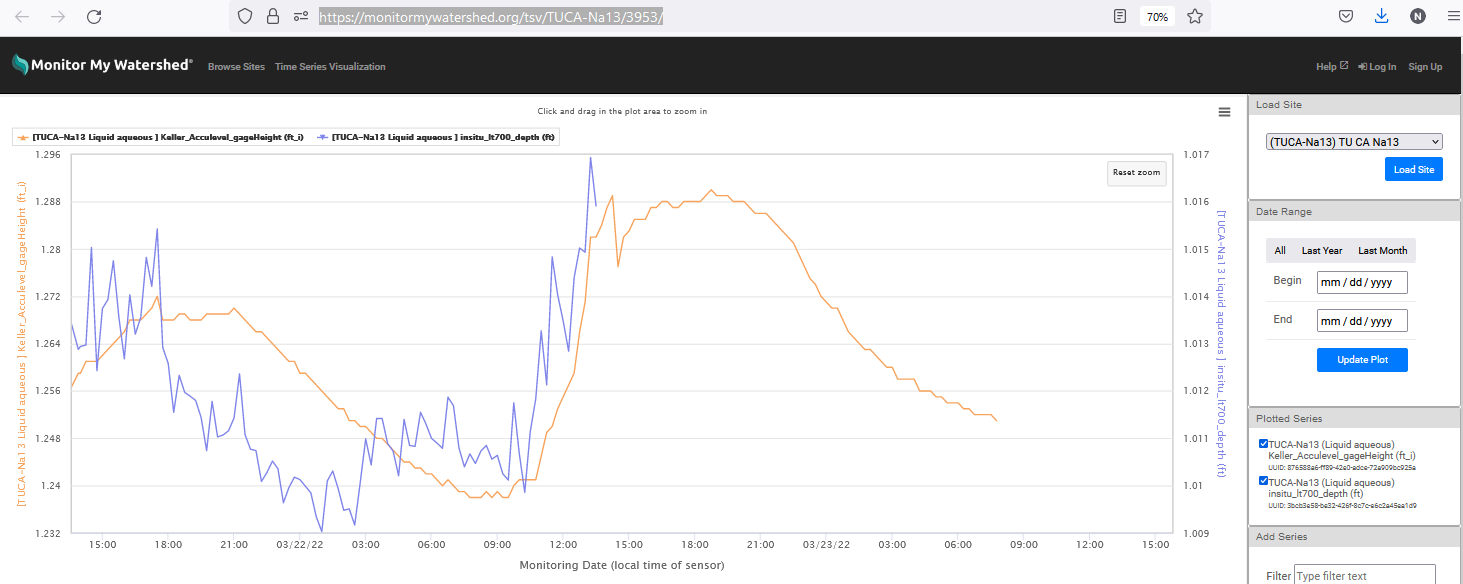
The detailed graph just stops showing the data - ie it already seems to be filtered?
https://monitormywatershed.org/tsv/TUCA-Na13/3953/
Unfortunately, this feature request is a complicated task and is outside the scope of our current milestone (i.e. it didn't exist with the previous TSA), so we need to postpone work to a future release.
We hope that some of the need for this feature might be alleviated with the current release with:
- #540
We do understand the value of this improvement, and will try to tackle it in the next release.