mqtt-realtime-chart-server
 mqtt-realtime-chart-server copied to clipboard
Express.js - MQTT - Socket.io application for real-time streams
mqtt-realtime-chart-server
This project demonstrates the visualization of high-frequency data streams (50Hz+) with Rickshaw.js chart library!
mqtt-realtime-chart-server is a Express.js - MQTT - Socket.io application, which works in conjunction with mqtt-realtime-chart-client.

Features
Server
- publishes and subscribes to MQTT topic (e.g. voltage)
- forwards the received messages to the client using websockets
Client
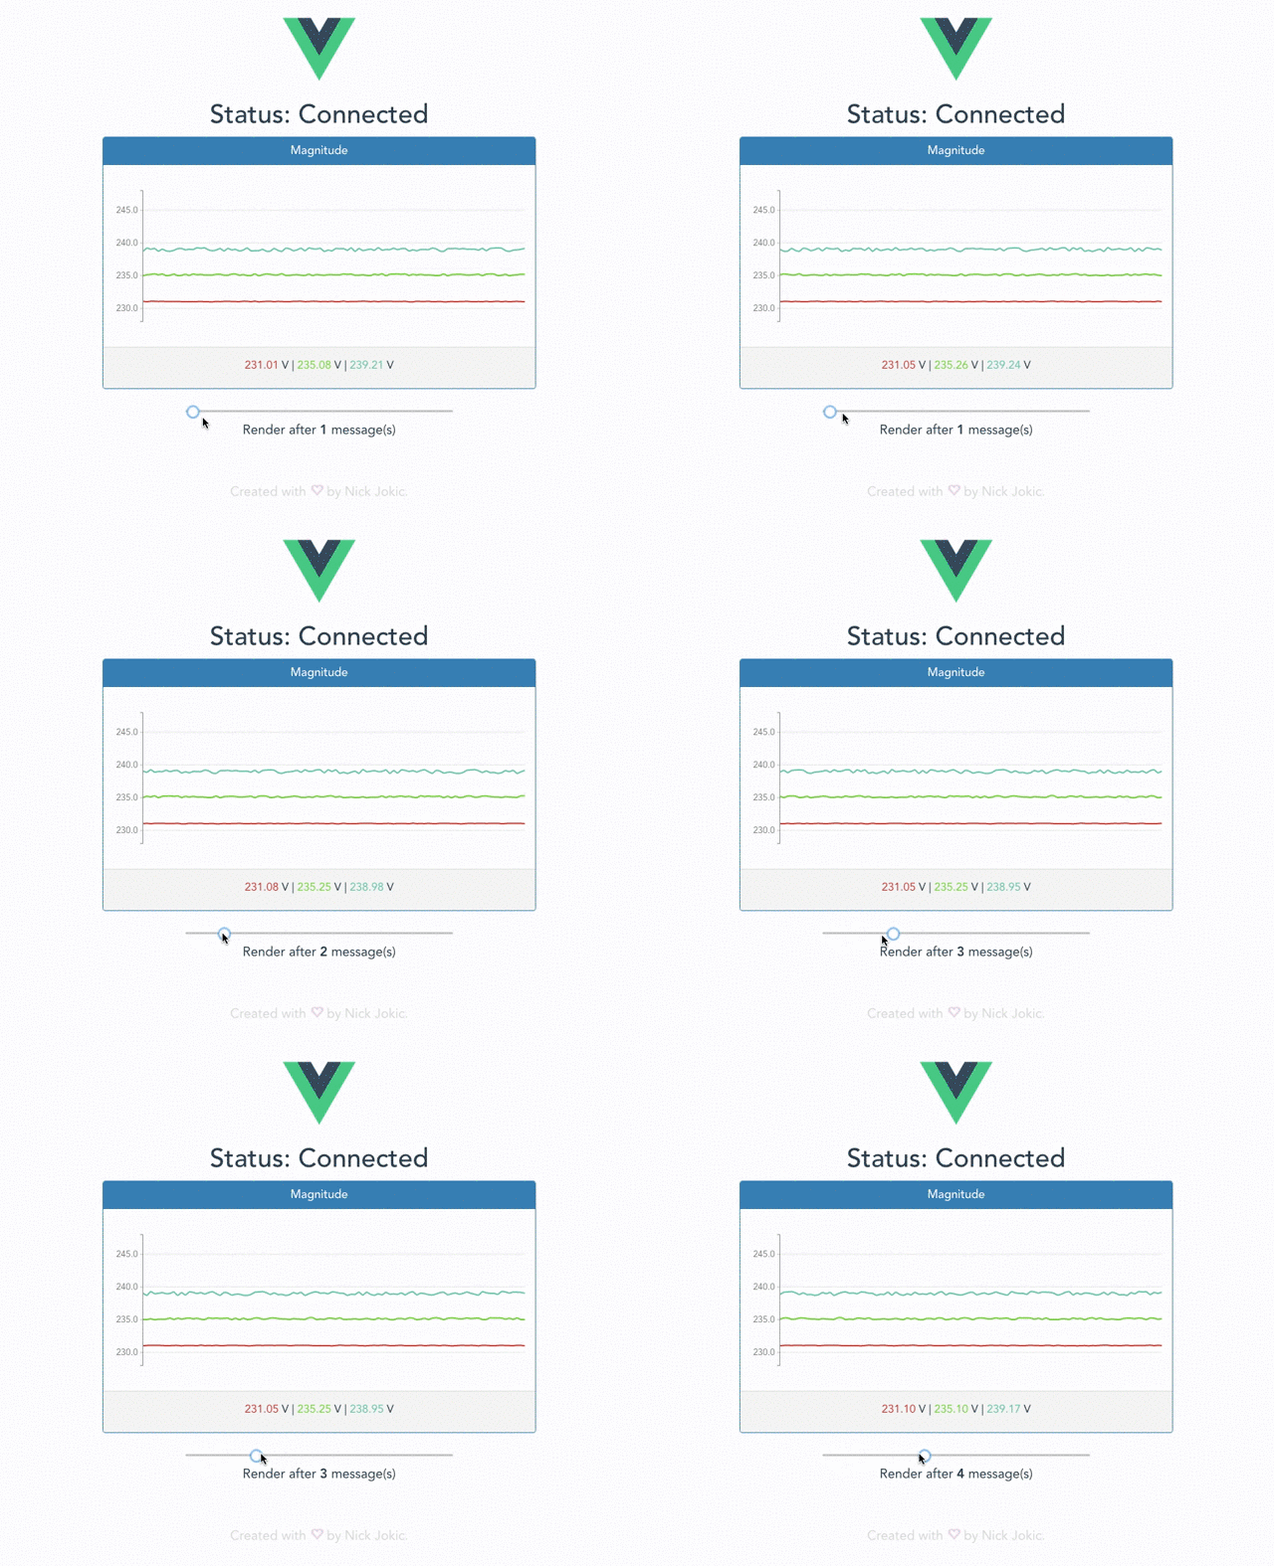
- real-time data visualization with a multi-series line chart
- dynamic slider which controls the chart render frequency (renders chart after N message(s))
- this is useful for optimization purposes, especially in high-frequency real-time streams, where you can lower the chart render calls in order to lessen the CPU load.
Getting Started
Prerequisites
Before you run the client, be sure you have these downloaded/installed on your machine:
- node.js
- npm
- mqtt-realtime-chart-client
- Moquette (MQTT broker) (or any other MQTT broker that listens on port 1883)
- If using Moquette, be sure to have Java JDK installed (tested with JDK 8)
Installing
To get started with this project, follow the 3-step installation, described here.
1. Moquette
The following commands will unpack and run the Moquette broker, which listens on port 1883:
tar zxf distribution-0.10-bundle-tar.tar.gz
cd bin
./moquette.sh
Windows specific:
cd bin
.\moquette.bat
2. mqtt-realtime-chart-server *(this repo)*
Navigate inside the root folder and run:
npm install
npm start
this will install the dependencies and start the express server locally on port 3000.
If the server-app and Moquette are already running in separate terminals, you can see the data stream inside the terminal. You can also check out the stream with a 3rd party MQTT client (e.g. MQTTfx) by connecting to 0.0.0.0:1883 and subscribing to topic voltage.
3. mqtt-realtime-chart-client
Before running the client, be sure you have already completed steps 1 and 2, and have both Moquette and mqtt-realtime-chart-server running in separate terminal windows.
Open a new terminal window and navigate inside the root folder of the client application, then run:
npm install
npm start
After compilation, you will see the link in the terminal (e.g. http://localhost:8081) where the application is currently running. Use your browser to navigate to that link.
If everything went smoothly, you should see a real-time chart with data frequency of around 50Hz.
Built With
Server
- Express.js - minimalist web framework for node.
- Socket.io - real-time bidirectional event-based communication using websockets
- MQTT.js - MQTT client for Node.js and the browser
Client
- Vue.js - JavaScript framework for building UI on the web.
- Rickshaw.js - JavaScript toolkit for creating interactive real-time graphs
- Socket.io-client - real-time bidirectional event-based communication using websockets (client)
- Bootstrap - HTML, CSS, and JavaScript framework for developing responsive, mobile first projects on the web.
Authors
- Nick Jokic - GitHub
License
This project is licensed under the MIT License.
Acknowledgments
- God bless the creators and contributors of Moquette for their 1 minute set up!