nheko
 nheko copied to clipboard
Nheko 100% one core
Describe the bug
Nheko opens at 56% cpu usage in one core, which then slowly increases to 100% in around 1 minute
I'll try to find the debug the problem, which was introduced in the last month, maybe due to a qt6 package upgrade or nheko change. Just reporting the issue for now.
To Reproduce/Environment
- Open nheko
Version: commit g9abc44ef Theme: Breeze QT_QPA_PLATFORMTHEME="qt6ct"
Operating system
Linux
Installation method
AUR
Qt version
qt6-base 6.6.2
Nheko 0.9.2 is very old. It is very likely we fixed this bug already, can you try to verify that on a more recent release? (Although your commit seems to point to a more recent version? Maybe you are actually on some older version of the master branch and you are hitting an issue with the KDE theme? Please fill out the install method and version properly, otherwise this is very confusing!)
Installed from the AUR, I saw "AUR" in the options and didn't even read the rest, my bad, thought it was properly specified
Hmm, I have the same issue since today, nheko 0.12.0-4 (https://archlinux.org/packages/extra/x86_64/nheko/). I already restarted nheko, didn't change anything.
EDIT: Now I can't reproduce it anymore. Will attempt to debug it should it ever happen again.
Happened to me again today. The thread that causes the high CPU usage has PID 2042 in my system:
Thread 19 (Thread 0x78e1eac006c0 (LWP 2042) "nheko"):
#0  0x000078e2499288b2 in epoll_wait () at /usr/lib/libc.so.6
#1  0x000078e247bb2d03 in ??? () at /usr/lib/libevent_core-2.1.so.7
#2  0x000078e247bb0185 in event_base_loop () at /usr/lib/libevent_core-2.1.so.7
#3  0x000078e249ae1cf4 in std::execute_native_thread_routine (__p=0x57250aba0dd0) at /usr/src/debug/gcc/gcc/libstdc++-v3/src/c++11/thread.cc:104
#4  0x000078e2498a339d in ??? () at /usr/lib/libc.so.6
#5  0x000078e24992849c in ??? () at /usr/lib/libc.so.6
Via strace I can observe that it's constantly calling epoll_wait:
strace: Process 2042 attached
epoll_wait(55, [{events=EPOLLIN|EPOLLERR|EPOLLHUP, data={u32=18, u64=18}}, {events=EPOLLIN|EPOLLERR|EPOLLHUP, data={u32=17, u64=17}}], 32, -1) = 2
epoll_wait(55, [{events=EPOLLIN|EPOLLERR|EPOLLHUP, data={u32=18, u64=18}}, {events=EPOLLIN|EPOLLERR|EPOLLHUP, data={u32=17, u64=17}}], 32, -1) = 2
epoll_wait(55, [{events=EPOLLIN|EPOLLERR|EPOLLHUP, data={u32=18, u64=18}}, {events=EPOLLIN|EPOLLERR|EPOLLHUP, data={u32=17, u64=17}}], 32, -1) = 2
epoll_wait(55, [{events=EPOLLIN|EPOLLERR|EPOLLHUP, data={u32=18, u64=18}}, {events=EPOLLIN|EPOLLERR|EPOLLHUP, data={u32=17, u64=17}}], 32, -1) = 2
epoll_wait(55, [{events=EPOLLIN|EPOLLERR|EPOLLHUP, data={u32=18, u64=18}}, {events=EPOLLIN|EPOLLERR|EPOLLHUP, data={u32=17, u64=17}}], 32, -1) = 2
epoll_wait(55, [{events=EPOLLIN|EPOLLERR|EPOLLHUP, data={u32=18, u64=18}}, {events=EPOLLIN|EPOLLERR|EPOLLHUP, data={u32=17, u64=17}}], 32, -1) = 2
...
Hi, i am having a similar issue since a few days ago. Nheko starts at normal cpu usage, then it keeps at 25%, which used not to be the normal CPU usage.
Version: 0.12.0-4 (archlinux)
I now downgraded every package I recently updated that nheko even remotely depends on, even the kernel, but I still experience this issue. I just recorded some traces via perf in the hopes that these shine some light on what's wrong here.
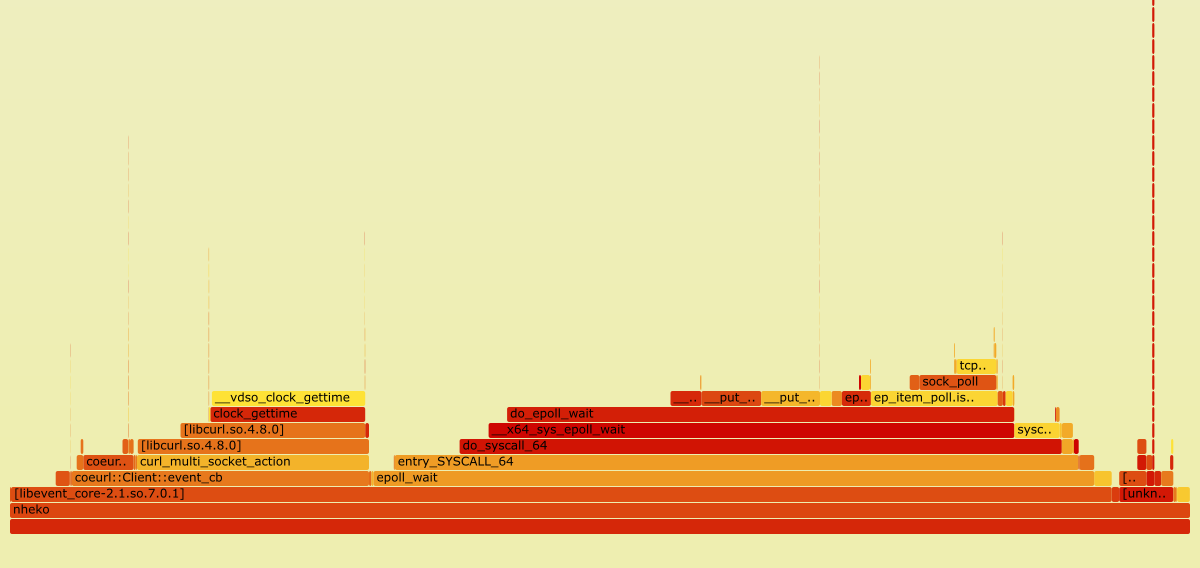
I also attached the folded traces the image was generated from: folded-traces.txt
If there's anything else I can do to help debug this issue, please let me know.
I have a similar issue, using nheko 0.12.0 from archlinux, using curl 8.9.0-1 from archlinux.
strace -f -p $(pidof nheko) repeats a line like this:
[pid 109002] epoll_wait(52, [{events=EPOLLIN, data={u32=204, u64=204}}, {events=EPOLLIN, data={u32=69, u64=69}}, {events=EPOLLIN, data={u32=98, u64=98}}, {events=EPOLLIN, data={u32=111, u64=111}}, {events=EPOLLIN, data={u32=112, u64=112}}, {events=EPOLLIN, data={u32=117, u64=117}}, {events=EPOLLIN|EPOLLERR|EPOLLHUP, data={u32=116, u64=116}}, {events=EPOLLIN|EPOLLERR|EPOLLHUP, data={u32=10, u64=10}}, {events=EPOLLIN, data={u32=126, u64=126}}, {events=EPOLLIN, data={u32=132, u64=132}}, {events=EPOLLIN, data={u32=160, u64=160}}, {events=EPOLLIN, data={u32=198, u64=198}}, {events=EPOLLIN, data={u32=200, u64=200}}], 32, -1) = 13
all the mentioned file descriptors having only EPOLLIN events belong to HTTP3 connections. I suspect the other (EPOLLIN|EPOLLERR|EPOLLHUP) ones too, but they are not mentioned in lsof -n -i -a -p $(pidof nheko).
I believe that this issue is due to the recent bug in curl 8.9: https://github.com/curl/curl/issues/14280
Installing the curl 8.9.1 from archlinux core/testing does change things: now the 100% cpu usage begins right at starting nheko and goes to normal after some minutes.
strace shows it handling different file descriptors (that do not have events pending)
...
[pid  7848] poll([{fd=67, events=POLLIN|POLLPRI|POLLRDNORM|POLLRDBAND}], 1, 0) = 0 (Timeout)
[pid  7848] recvmmsg(67, 0x770f714bc420, 32, 0, NULL) = -1 EAGAIN (Resource temporarily unavailable)
[pid  7848] rt_sigaction(SIGPIPE, {sa_handler=SIG_DFL, sa_mask=[], sa_flags=SA_RESTORER, sa_restorer=0x770fa0e4c1d0}, NULL, 8) = 0
[pid  7848] poll([{fd=74, events=POLLIN|POLLPRI|POLLRDNORM|POLLRDBAND}], 1, 0) = 0 (Timeout)
[pid  7848] recvmmsg(74, 0x770f714bc420, 32, 0, NULL) = -1 EAGAIN (Resource temporarily unavailable)
[pid  7848] rt_sigaction(SIGPIPE, {sa_handler=SIG_DFL, sa_mask=[], sa_flags=SA_RESTORER, sa_restorer=0x770fa0e4c1d0}, NULL, 8) = 0
[pid  7848] poll([{fd=75, events=POLLIN|POLLPRI|POLLRDNORM|POLLRDBAND}], 1, 0) = 0 (Timeout)
[pid  7848] recvmmsg(75, 0x770f714bc420, 32, 0, NULL) = -1 EAGAIN (Resource temporarily unavailable)
[pid  7848] rt_sigaction(SIGPIPE, {sa_handler=SIG_DFL, sa_mask=[], sa_flags=SA_RESTORER, sa_restorer=0x770fa0e4c1d0}, NULL, 8) = 0
...
Hi, i have updated my system (archlinux) and i have noticed that curl package was updated( core repository not testing). After checking the bug @redsky17 mentioned, i noticed that there has been some activity there and it was merged into the curl master. Since the curl package in archlinux has been updated yesterday too, i have ran nheko for several minutes, and i noticed there is no more high cpu usage on my side ( nheko used to take 25% CPU, now its value is closer to 1% as before).
I also ran # strace -f -p $(pidof nheko) as it was mentioned before, and i also noticed that the ...epoll_wait(52,.... lines i used to have are not there anymore. Those were reported by another user in a previous comment, and i have verified them (a few days ago) myself, now they are absent.
Not sure if the other users are having exactly the same issue, so i write this so you can have a try with the new curl version.
I can also confirm that switching from libcurl 8.9.0 to 8.9.1 fixes this issue with nheko (and introduces an issue with transmission...).
I'll close this then, since this seems to have been a curl issue for most of you? Please reopen if you still have high CPU on a current version and have curl 8.9.1 or higher.