FabricPool engine performance dashboard
Is your feature request related to a problem? Please describe. Customer and ISP should have a better look inside FabricPool engine metrics
Describe the solution you'd like Harvest could come with a dashboard about:
- S3 put/get performance (objects/sec, MB/sec bandwidth)
- latency from bucket
- breakout to show % of get size from 4 to 256 KB.
- unreferenced blocks rate for a given volume
- reclamation performance
all metrics you could have with storage object profiler from Ontap.
Describe alternatives you've considered A clear and concise description of any alternative solutions or features you've considered.
Additional context Add any other context or screenshots about the feature request here.
Including the cli command matthieu-sudo sent earlier, apparently this is a diag only command
storage aggregate object-store profiler show
REST private cli may be an option
curl -k -uharvestnew "https://10.193.48.11/api/private/cli/storage/aggregate/object-store/profiler"
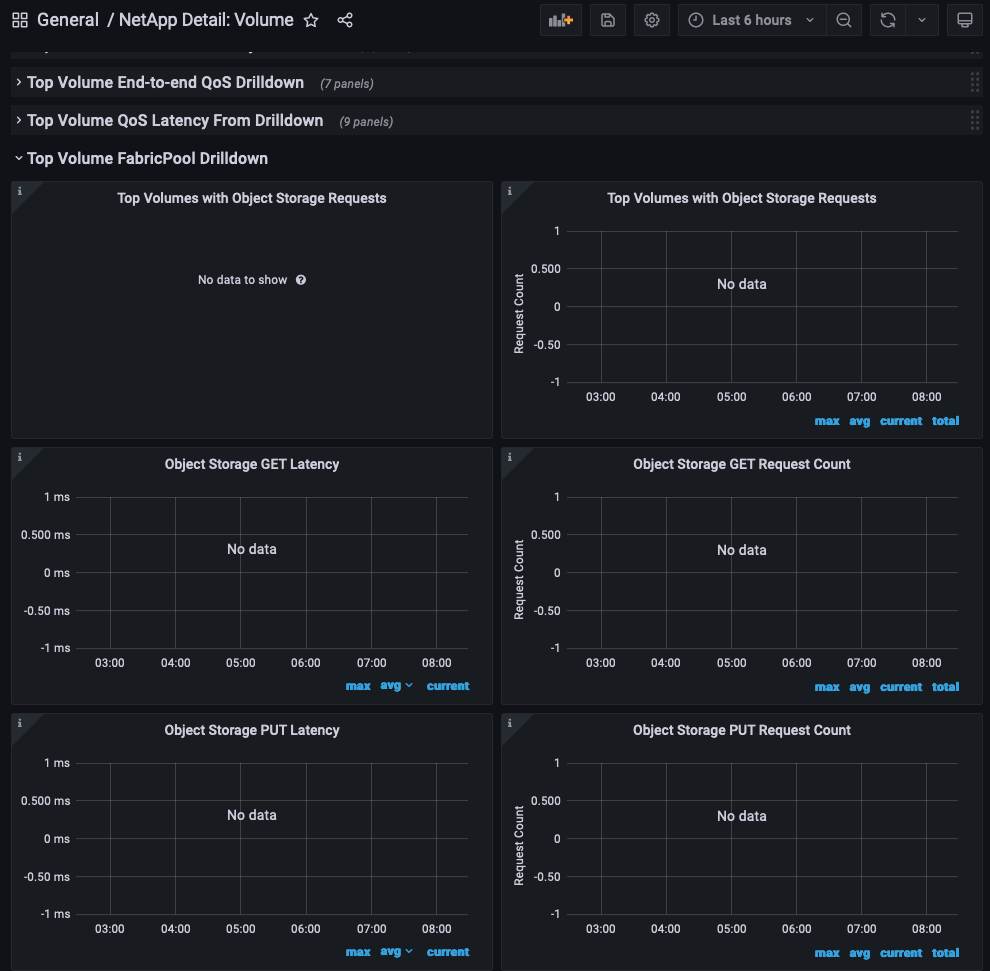
Discussed with @shubhammer and he confirmed that Harvest 1.6 included Fabric Pool panels