NetApp Overview cDot Dashboard
can you build this dashboard for harvest 2 also? https://grafana.com/grafana/dashboards/10181-netapp-overview/
Thanks @T1r0l we'll take a look. We have plans to add a higher-level summary dashboard similar to this one.
Another example dashboard posted to Discord https://grafana.com/grafana/dashboards/14179-grafana-dashboard-for-netapp-ontap-v9-8/
Incorporate steps from https://kb.netapp.com/Advice_and_Troubleshooting/Data_Storage_Software/ONTAP_OS/ONTAP_9_Performance_-_Resolution_Guide#s58720
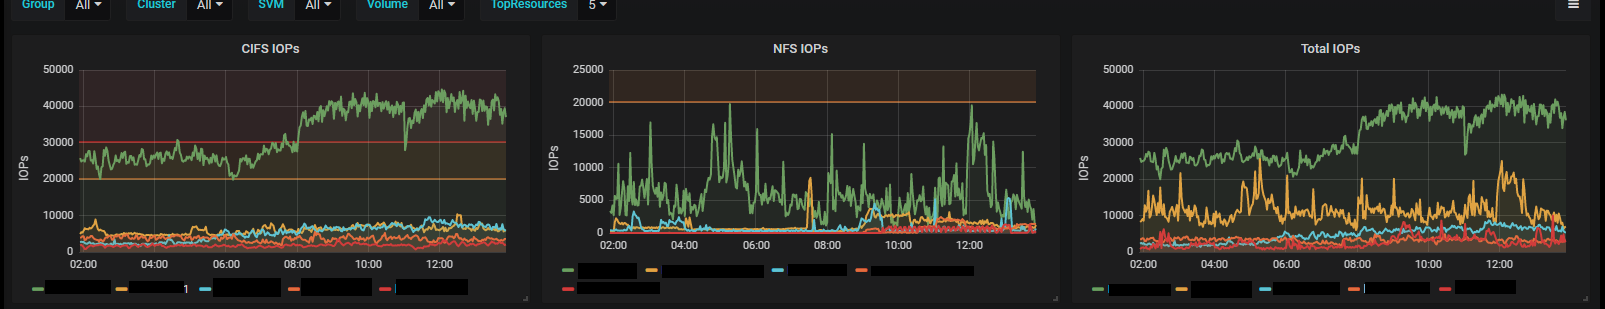
IOPS CIFS/NFS in the screenshot (https://grafana.com/grafana/dashboards/10181-netapp-overview/) doesn't match with our dashboard
From screenshot:
From cdot dashboard harvest:
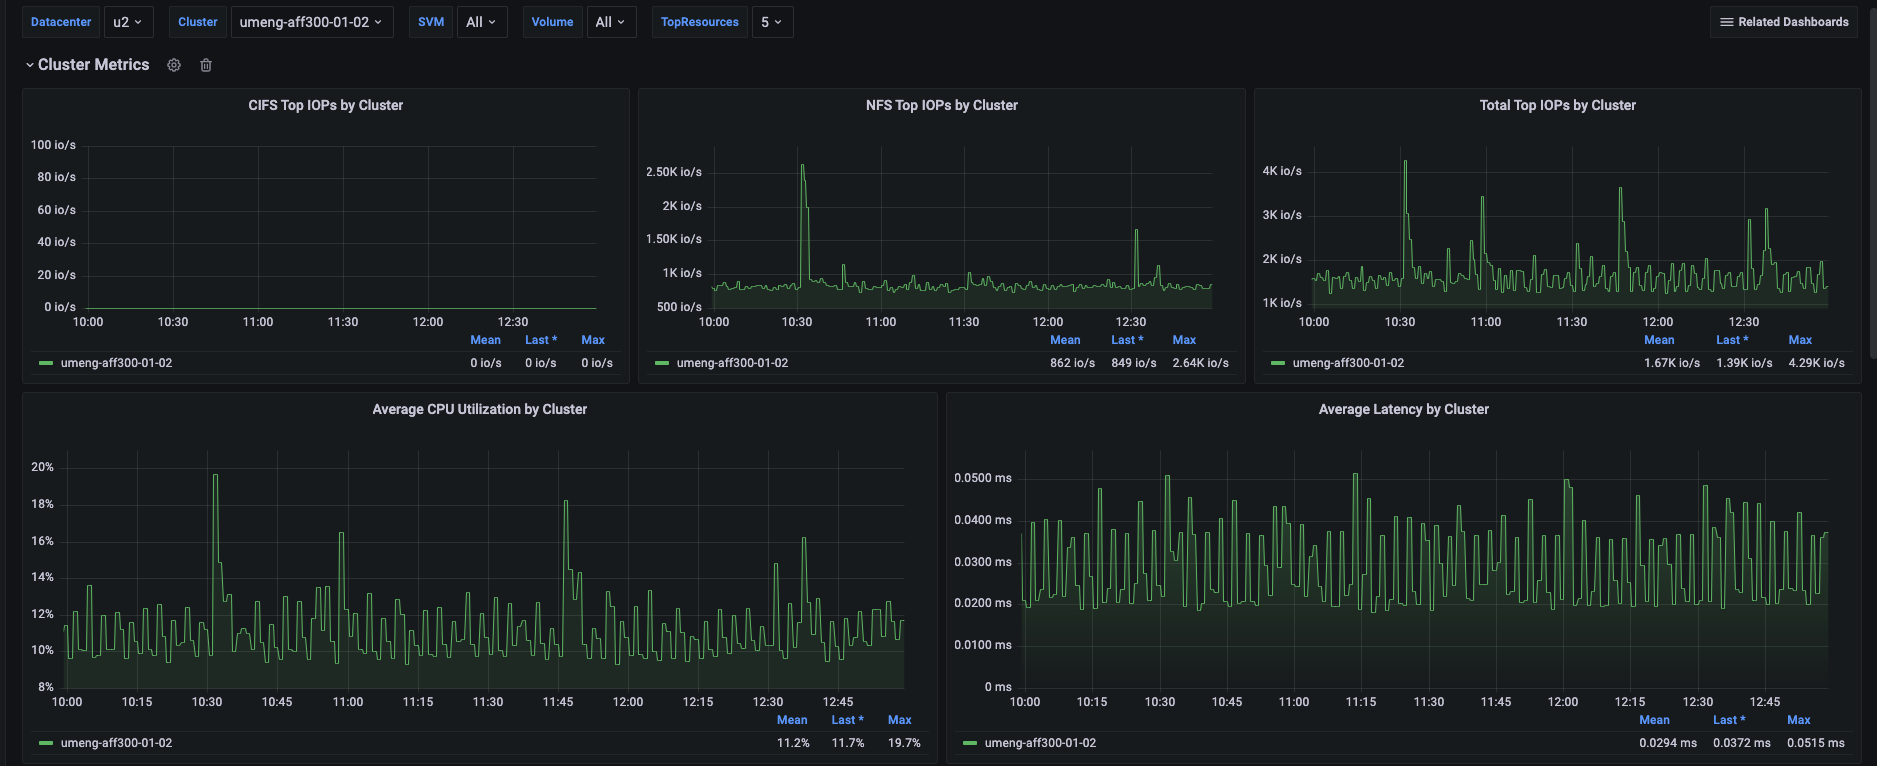
Our dashboard is on cluster level while customer ask is probably on object level.
The panels as per the link: https://grafana.com/grafana/dashboards/10181-netapp-overview/ are cluster level only. It shows 5 records (5 clusters) due to topk range selected.
This is the outlook of cDot dashboard when more clusters are present in datacenter.
topk selected as 5 but we have total 4 clusters in datacenter.

And yes, If we choose one cluster from cluster variable, then it would show that cluster's detail only
