Netapp Cluster View Dashboard for NABox 3
Looking to replicate the Netapp Cluster view dashboard from the old version before I migrate. Same view as the first screenshot on https://nabox.org/. This helps me keep an eye on all our Netapp clusters.
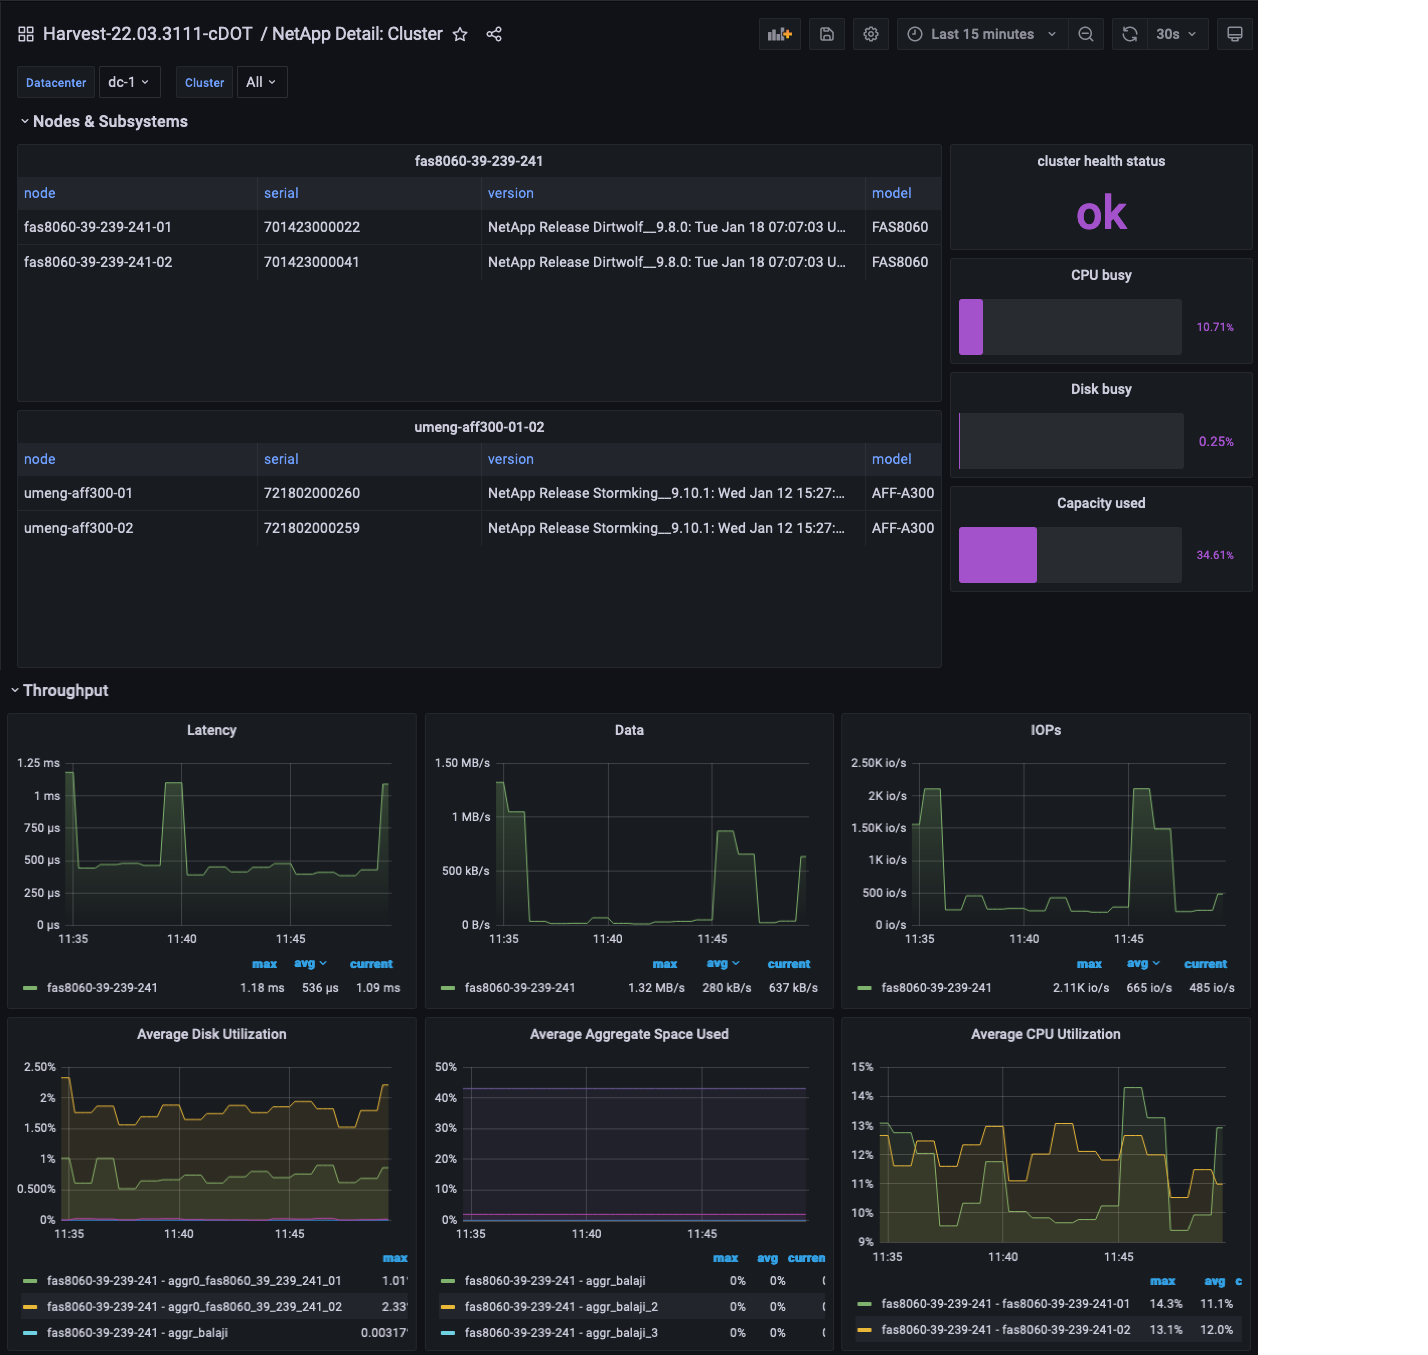
hi @outrebor1st have you checked out the current NetApp Detail: Cluster dashboard, (pasted below)?
It should have the same information as the Harvest 1.6 screenshot you pasted. The top section is configured a bit different to show more customer-requested data about model, serial, health, etc, but the graphs and throughput, latency, IOPS tables are all there.
If there's something missing or you'd like to suggest a change, the more specific, the better.
I've been working with this view for a few days but it doesn't provide the same results that I had previously. This gives cluster overviews - but I need node level breakdowns as I have a cluster with 10 nodes with various levels of disks (SAS, FSAS, and SSD) and I'd like to monitor, as well as multiple locations/datacenters that I am looking for issues in.
hi @outrebor1st
which version of Harvest are you using?
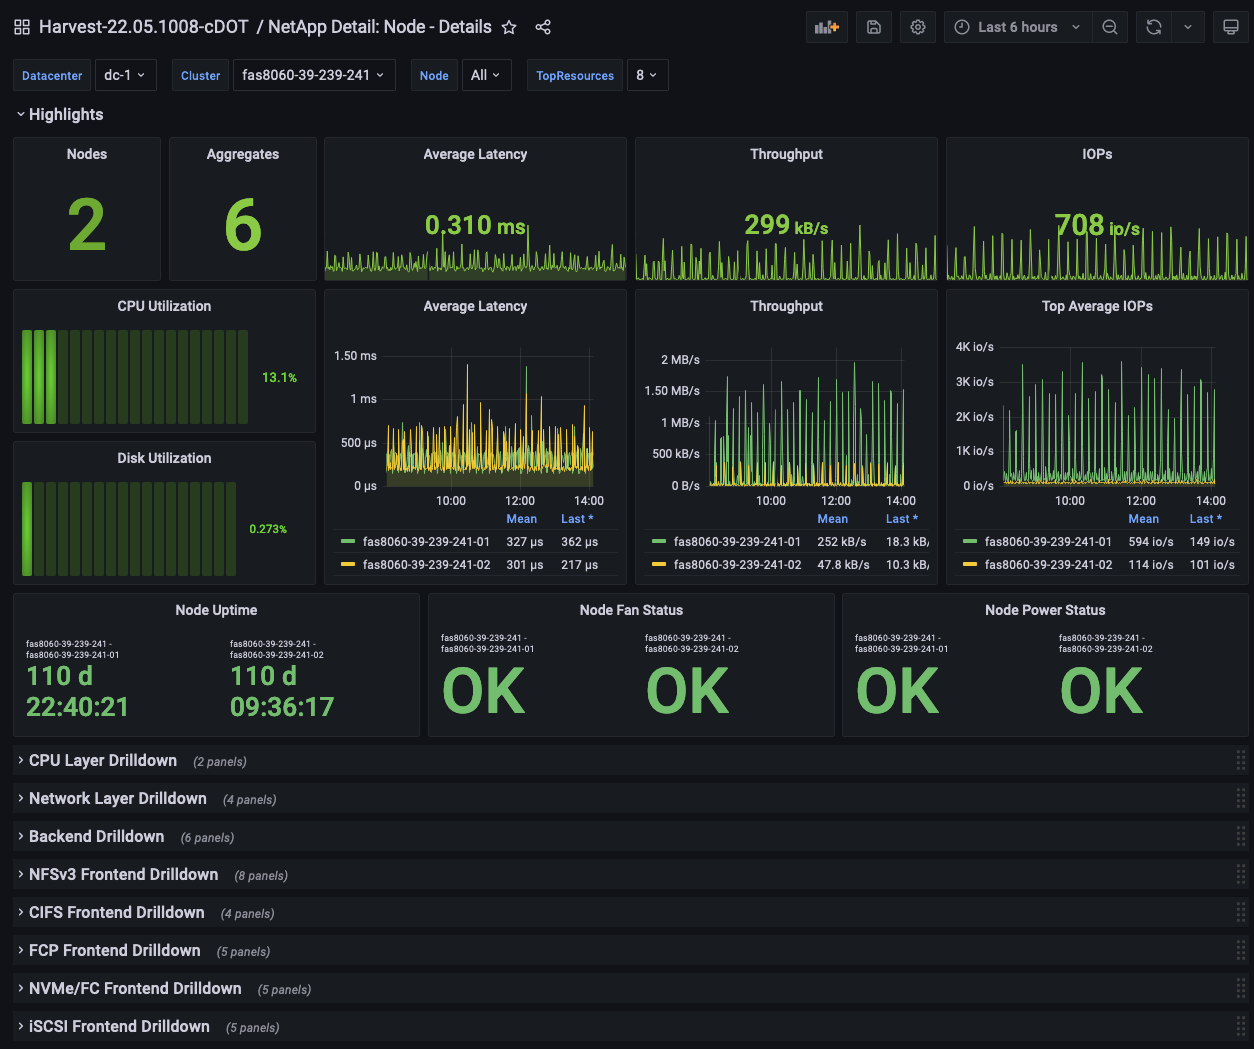
Does the node level breakdown shown in the [NetApp Detail: Node - Details] dashboard have what you need? Both dashboards have variables at the top that help filter the contents and in 22.05 we introduced an import switch to grafana import that modifies all dashboards as they are imported to add multi-select drop-downs for each variable.
Closing issue. @outrebor1st Please feel free to open if any further questions.