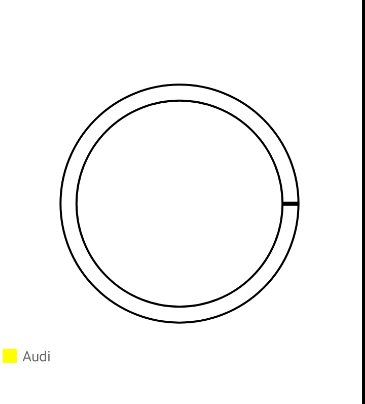
Pie chart with no color when have just one data
Environment
Describe the bug
When use a RadPieChart with DonutSeries and the data of chart is just one value this not show colors.
 Whith more data working correctly:

To Reproduce I use this issue model: https://www.telerik.com/forums/radpiechart-donutseries-slice-colors HTML: <GridLayout orientation="vertical" rows="*" tkExampleTitle tkToggleNavButton>
<RadPieChart height="300" allowAnimation="true" row="1">
    <DonutSeries seriesName="pie" tkPieSeries selectionMode="None" outerRadiusFactor="0.9" expandRadius="0.25" innerRadiusFactor="0.85"
        [items]="pieSource" valueProperty="Amount" legendLabel="Brand"></DonutSeries>
        <RadLegendView tkPieLegend position="Bottom" offsetOrigin="BottomLeft" width="110">
        </RadLegendView>
        <Palette tkPiePalette seriesName="pie">
            <PaletteEntry tkPiePaletteEntry fillColor="#ffff00" strokeColor="#000000">
            </PaletteEntry>
            <PaletteEntry tkPiePaletteEntry fillColor="#cc3399" strokeColor="#000000">
            </PaletteEntry>
                <PaletteEntry tkPiePaletteEntry fillColor="#ff6600" strokeColor="#000000">
                </PaletteEntry>
        </Palette>
    </RadPieChart>
import { Component, OnInit } from '@angular/core'; import { DataService } from '../data-services/data.service'; import { Car } from '../data-services/car'; import { ObservableArray } from "data/observable-array";
@Component({ moduleId: module.id, selector: 'tk-chart-styling-pie-series', providers: [DataService], templateUrl: 'chart-styling-pie-series.component.html' }) export class ChartStylingPieSeriesComponent implements OnInit { public pieSource: ObservableArray<Car>;
constructor() {
    this.pieSource=new ObservableArray([
        { Brand: "Audi", Amount: 10 },
        { Brand: "Mercedes", Amount: 76 },
        { Brand: "Fiat", Amount: 60 }
        ])
}


ngOnInit() {
}
} I just left the array of cars with a die : this.pieSource = new ObservableArray([ { Brand: "Audi", Amount: 10} ]);
Expected behavior Show color with one data
Have same issue ("@nativescript/angular": "^12.2.0", "nativescript-ui-chart": "^9.0.0").
P/s: can workaround by adding 0.00001 for the zero values.