grafana-plotly-panel
 grafana-plotly-panel copied to clipboard
Show plotly graph in grafana panel
Plot.ly Panel for Grafana


Render metrics using the plot.ly javascript framework
Works with grafana 4, 5, and 6
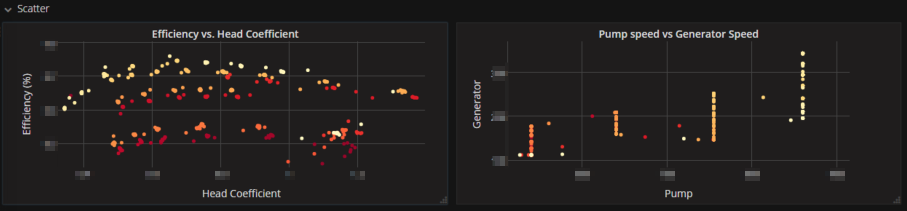
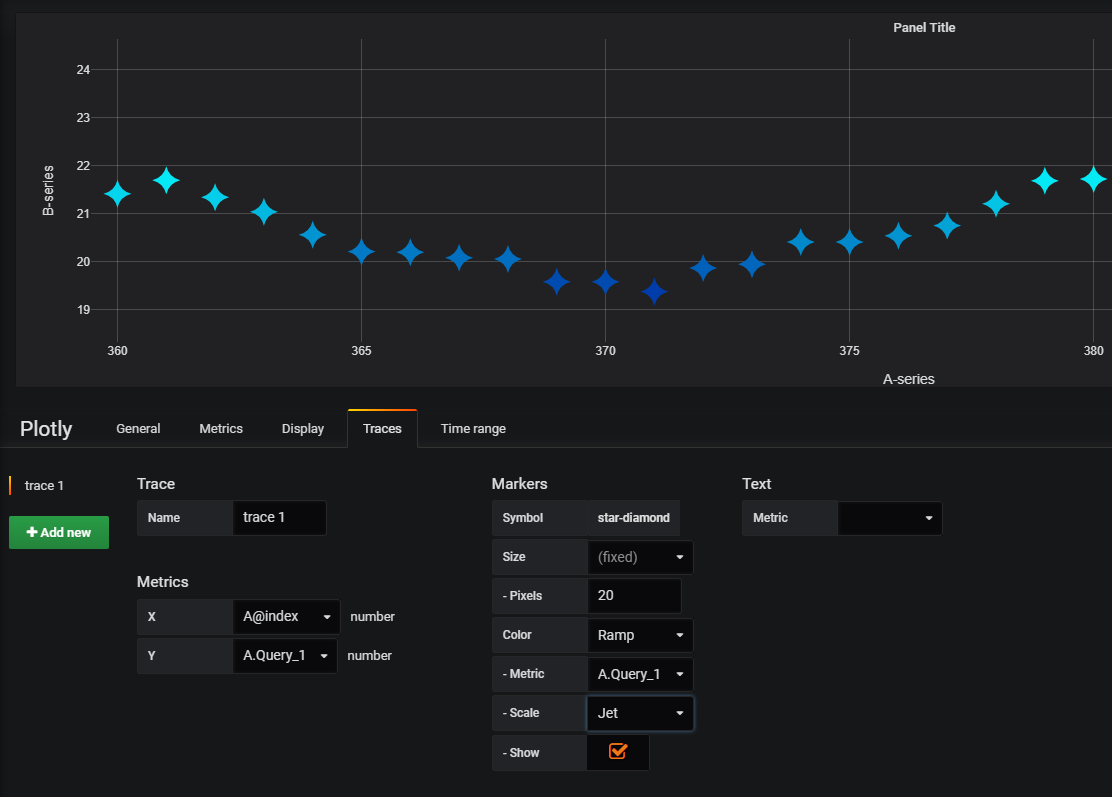
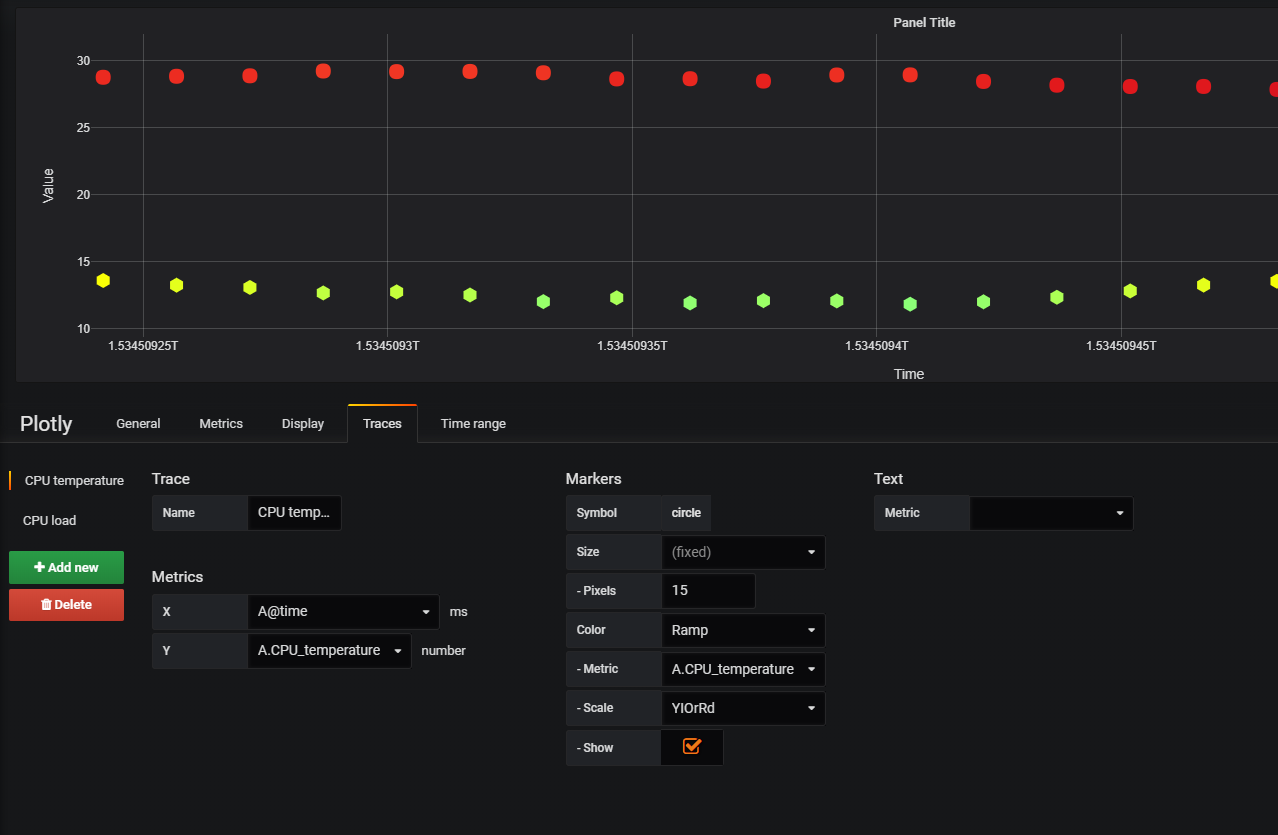
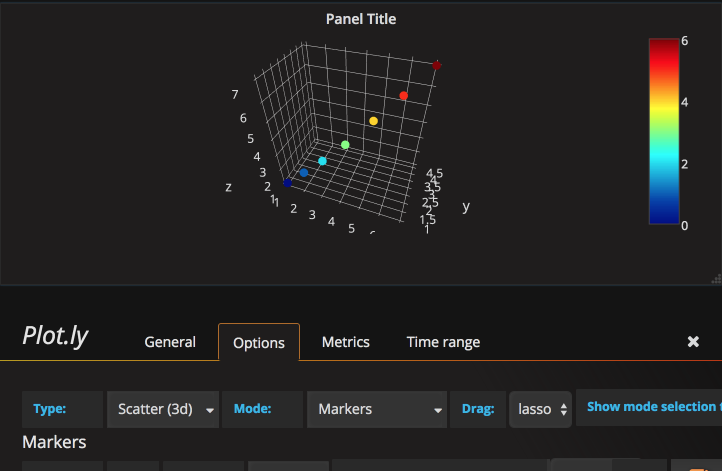
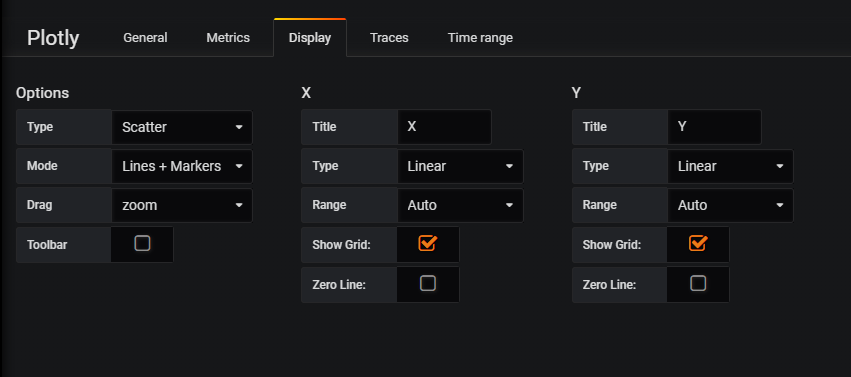
Screenshots
Building
To complie, run:
npm install -g yarn
yarn install --pure-lockfile
yarn build
Releasing
This plugin uses release-it to release to GitHub.
env GITHUB_TOKEN=your_token yarn release-it patch
Changelog
v0.0.6
- Fix axis range configuration bug #49
- Add basic annotations support #57 (tchernobog)
- Improve loading times for plotly.js and support loading from CDN
- Assume date x-axis when 'auto' and the mapping has 'time'
- Support Fixed-Ratio Axes
- Tested with Grafana 6
v0.0.5
- Upgrade plotly (v1.41+)
- Better support for light theme. (#24, @cscheuermann81)
- Support snapshots
- Removing
distfrom master branch - Support of multiple time series's (#9, CorpGlory DevTeam)
- Support showing text from query (#11)
- Template variable support
- Improved metric mapping
- Using webpack and basic jest tests
v0.0.4
- Load plotly from npm (v1.31.2+)
- Convert to TypeScript
- Reasonable behavior when adding single metric
- Formatting with prettier.js
- Support for a single table query
v0.0.3
- Improve options UI
- Added range mode: "tozero" and "nonnegative"
- Map metrics to X,Y,Z and color
- Can now select 'date' type for each axis to support time
- basic support to size marker with data
v0.0.2
- Added ability to set color from a metric query. (#4, @lzgrablic01)
- Show 3D axis names properly
- Fix initalization to work with 4.2+ (isPanelVisible undefined)
v0.0.1
- First working version
Wishlist (help wanted)
- sizeref helper. I think this depends on the data. likely need to find the range and pick a good value? From react?
- nice to have: https://plot.ly/javascript/parallel-coordinates-plot/