grafana-discrete-panel
 grafana-discrete-panel copied to clipboard
Allow Prometheus label to be a "value"
I use Grafana with Prometheus.
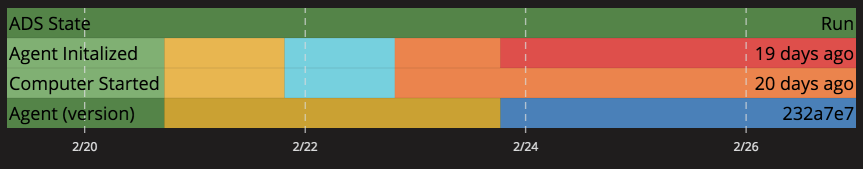
Rather than showing the value of a timeserie , I want to show a Prometheus label value (software version...), quite like in this example for the line "Agent (version)":
 It would be nice to document how to achieve this (I beleive it isn't possible with Prometheus yet. is it ?)
For exemple, considering a metric like prometheus_build_info, the label version would be used as the value.
prometheus_build_info{instance="localhost:9090",version="2.8.0"}
prometheus_build_info{instance="localhost:9090",version="2.9.0"}
Ideally, both series should be merged on a single timeline like this:

i have a similar use case when i want to show some tag information from influx instead of the values. i have the values in other panels but would like to show which tag that was worked on in a machine for a set of time (there can only be one at a time since the tag is telling variant in a discrete production for a production cell)
With Grafana 7+ you could use the transform feature.
For example if you have the series with the only one label state you could add the following transforms:
