[QST] Profiling difference between GemmUinversal and Gemm?
There are about 20% performance difference between cutlass profiler‘s GemmUniversal kernel and my Gemm kernel (they look like same kernel).
GPU: T4, persistent mode: ON, locked on 1590MHz NVCC: 11.1 problem size: 4096x4096x4096
cutlass profiler kernel, nvprof time: 4.1689ms

my kernel (generated by scripts), nvprof time: 5.4512ms

Both above profiling with 100 iters. I think there maybe some reasons to cause this difference:
- There are some compiling setting in cutlass/library which I didn't set(I compiled with -O4)?
- There are some profiling setting in cutlass profiler which I didn't set(I set the persistent mode and frequency)?
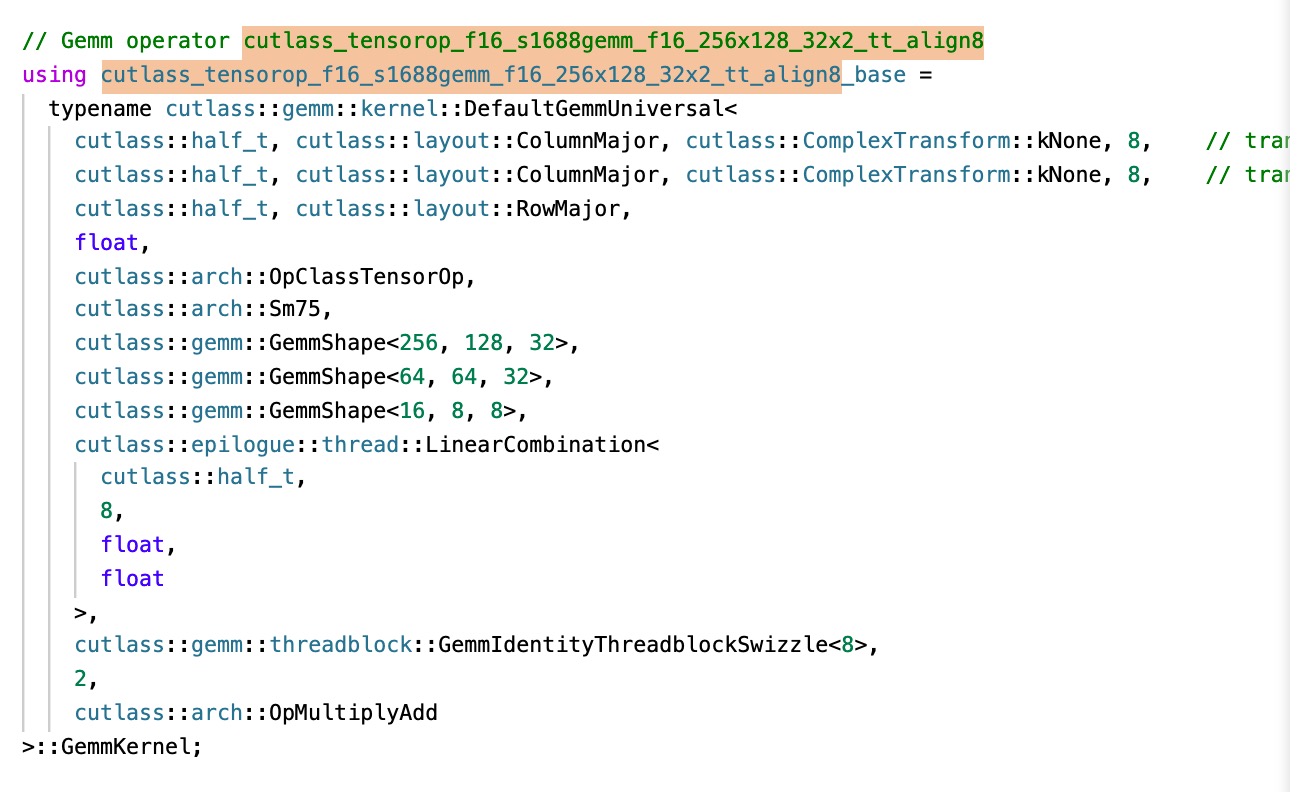
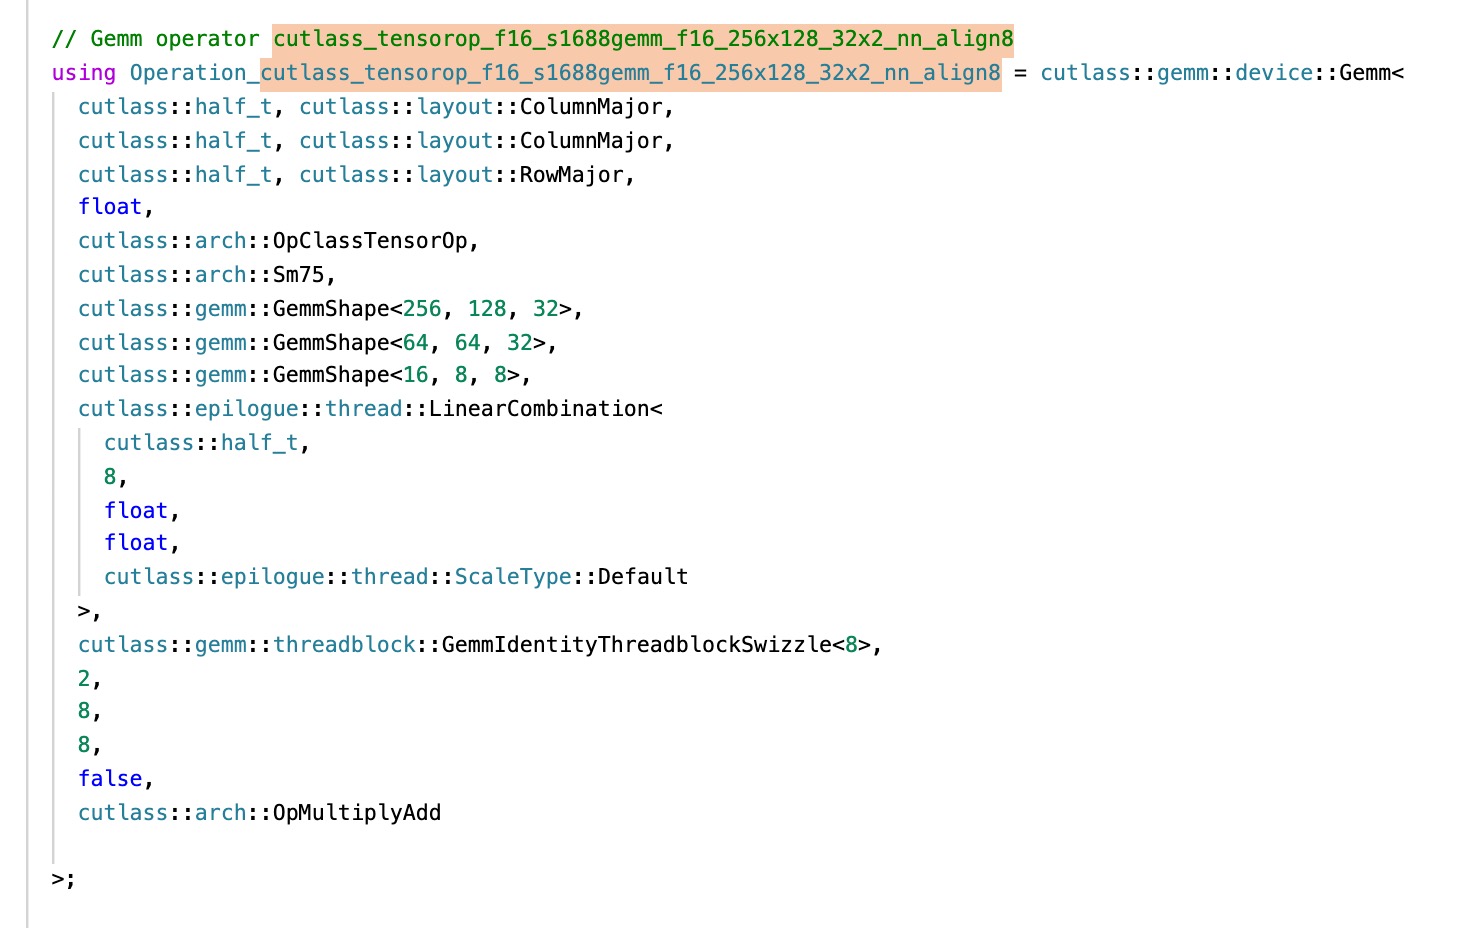
- There are implementation difference between GemmUniversal API and Gemm API?
- Other possible reason? Thanks a lot.
device::gemm_universal and device::gemm are the same if you don't run splitK or batched gemm. You can dump all the arguments to verify that both cases are running the same problem.
T4 has very low power limit. I think you can try to lower the frequency by a lot to make sure neither will hit the power throttle.
I recommend to use at least CUDA 11.3 to build cutlass gemm. Every version of nvcc improves the performance of one type of cutlass kernels.
CUDA 11.3 Tensor Core GEMM CUDA 11.4 Tensor Core Conv CUDA 11.5 Sparse Tensor Core GEMM CUDA 11.6 TF32x3
BTW, I don't think nvcc supports -O4.
I tried to compiling my kernel with NVCC 11.4. The profiling time improved from 5.4512ms to 5.1043ms. But the cutlass profiler's profiling time is also about 4.28195ms
Have your lowered the frequency?
Do you have one or two warmup runs? cutlass profiler has a warmup run. Usually the warmup run is much slower than the followup runs.
I have locked the frequency to 1005 MHz on T4. And I have 5 warmup runs, 100 profiling iters. The cutlass profiler's result is 3.72416ms, my kernel's result is 5.1481ms. Cublas's result is 4.9844ms. Seems that cutlass profiler is faster on NVCC 11.4 than 11.1 (also my kernel). But there are still difference between cutlass profiler and my kernel.
Then, I will really have no idea.
Here is the code of device::gemm https://github.com/NVIDIA/cutlass/blob/master/include/cutlass/gemm/kernel/gemm.h#L187-L352
Here is the code of device::gemm_universal https://github.com/NVIDIA/cutlass/blob/master/include/cutlass/gemm/kernel/gemm_universal.h
The only difference that you can see is that gemm_univeral checks some modes that you don't use in the prologue and epilogue. The mainloops are the same. Maybe you can comment out some code to make two versions the same and check again.
Also, you can use nsight to check the performance.
Some one also reported before in the github that changing T4 driver also has big impact on the performance. Maybe you can try that too.
Also cutlass nvcc command line is like this
nvcc -DCUTLASS_ENABLE_CUBLAS=1 -DCUTLASS_NAMESPACE=cutlass -I/home/scratch.haichengw_gpu/cutlass_public/include -I/home/scratch.haichengw_gpu/cutlass_public/examples/common -I/home/scratch.haichengw_gpu/cutlass_public/build/include -I/home/scratch.haichengw_gpu/cutlass_public/tools/util/include -O3 -DNDEBUG -Xcompiler=-fPIE -DCUTLASS_ENABLE_TENSOR_CORE_MMA=1 -DCUTLASS_TEST_LEVEL=0 -DCUTLASS_TEST_ENABLE_CACHED_RESULTS=1 -DCUTLASS_CONV_UNIT_TEST_RIGOROUS_SIZE_ENABLED=1 -DCUTLASS_DEBUG_TRACE_LEVEL=0 -Xcompiler=-Wconversion -Xcompiler=-fno-strict-aliasing -gencode=arch=compute_75,code=[sm_75,compute_75] -std=c++11 -x cu -c /home/scratch.haichengw_gpu/cutlass_public/examples/18_ampere_fp64_tensorop_affine2_gemm/ampere_fp64_tensorop_affine2_gemm.cu -o CMakeFiles/18_ampere_fp64_tensorop_affine2_gemm.dir/ampere_fp64_tensorop_affine2_gemm.cu.o
This issue has been labeled inactive-30d due to no recent activity in the past 30 days. Please close this issue if no further response or action is needed. Otherwise, please respond with a comment indicating any updates or changes to the original issue and/or confirm this issue still needs to be addressed. This issue will be labeled inactive-90d if there is no activity in the next 60 days.
This issue has been labeled inactive-30d due to no recent activity in the past 30 days. Please close this issue if no further response or action is needed. Otherwise, please respond with a comment indicating any updates or changes to the original issue and/or confirm this issue still needs to be addressed. This issue will be labeled inactive-90d if there is no activity in the next 60 days.