jsGraph
 jsGraph copied to clipboard
Dynamic graphing library

In this example: https://github.com/NPellet/jsGraph/blob/master/examples/v2/jsonScatter/manyOptions.json The scatter plot marker is not displayed in the legend 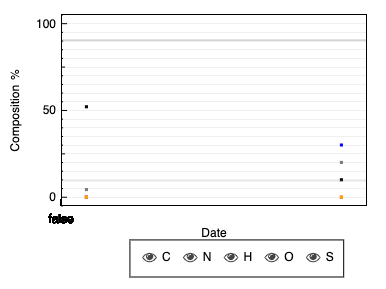
Would it be possible to be able to have an autoscale when we put only annotations ? Or more generally should the full zoom out also take into account annotations...
In this example: https://github.com/NPellet/jsGraph/blob/master/examples/v2/other/manyannotations.js I don't know how to specify that the axis should be a time series. Currently it displays 'false' on the axis 
Coud jsgraph accepts typed array for data input ? Currently it fails because it seems not to be able to get the axis boundary
I have a small test case But when I zoom the line of the left disappears and the one of the right is end outside the graph 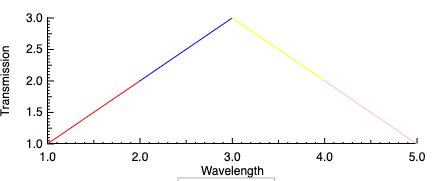 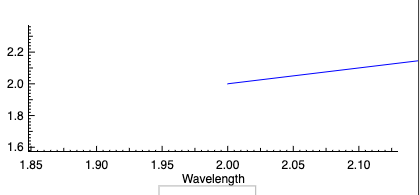 ```...
We would need in order to implement one of the react component we need to be allowed to have this kind of code: ```js // options.width, options.height const jsgraph =...

I'm counting at least 10 redraws