problem for plugin Pager
Make it hidden instead of style="display: none;" when it has big data, for example 1 million data, it still exists on the page please solve this. thanks the author
https://drive.google.com/file/d/1qvoxr0aYsoq8QItqErXErAK-Irpmny-p/view?usp=sharing
@Mottie Need help with Widget-chart, which can help to create more demos for Highcharts to be non-AK, Google Chart demos cannot be applied to other charts.
Here is the main demo - https://mottie.github.io/tablesorter/docs/example-widget-chart.html
I don't know what "non-AK" means.
Yes, I translated it quickly, so the word was wrong. I cannot apply follow to the main DEMO charts, because each Charts is different . I tried Highcharts, it didn't work. Please help with Highcharts.
https://mottie.github.io/tablesorter/docs/example-widget-chart.html#setup__highcharts
If those instructions don't help, please share some code so I can help troubleshoot the problem.
$table = $("table").trigger("chartData");
$("#chart").highcharts({
chart: { type: "column" },
title: {
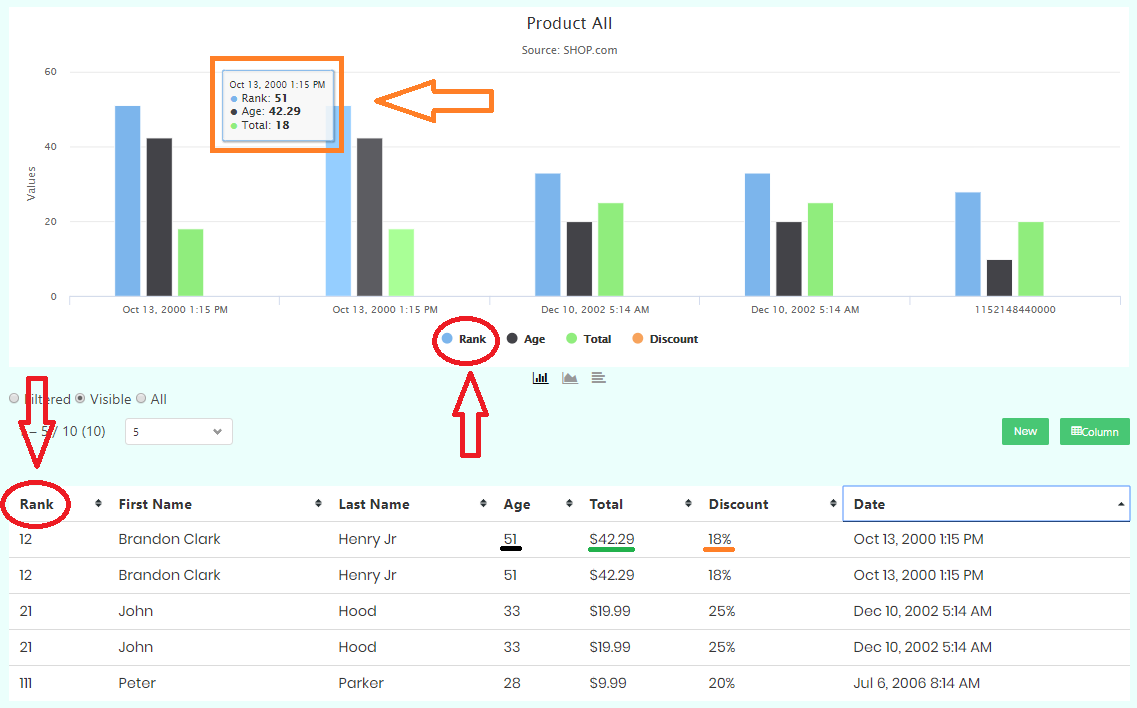
text: "Product All"
},
subtitle: {
text: "Source: SHOP.com"
},
tooltip: {
shared: true
},
xAxis: { categories: $table[0].config.chart.categories },
series: $table[0].config.chart.series
});
$("#chartSelect").change(function() {
$("#chart-container").slideToggle($(this).is(":checked"));
//drawChart();
});
$rowType.on("change", function() {
$table[0].config.widgetOptions.chart_incRows = $rowType
.filter(":checked")
.attr("data-type");
// update data, then draw new chart
$table.trigger("chartData");
//drawChart();
});
$table.on("columnUpdate pagerComplete", function(e) {
var table = this,
c = table.config,
t = types["pie"];
setTimeout(function() {
if (table.hasInitialized) {
$table.trigger("chartData");
//drawChart();
}
}, 10);
});
please a complete help, i don't know how to put it with Tablesorter
I set up this Highcharts demo for you. If you need further help, please modify that demo to show the problem.
Thank you for this, I tried it but I need more time to look it carefully because there is still an unattended place, it is basically already running. Maybe charts are always displayed alongside Table instead of clicking, I don't see this option?
Everything works well, the problem of ignoring Columns is not achieved. chart_ignoreColumns: [0, 1, 2], I cannot ignore data-column="0", other Columns are fine but the Columns 0 it has displayed overrides the other Columns. Take a look at the screenshot of Column 0 [Rank] displayed instead of Column 5 [Discount]. Help me solve this.