icingaweb2-module-grafana
 icingaweb2-module-grafana copied to clipboard
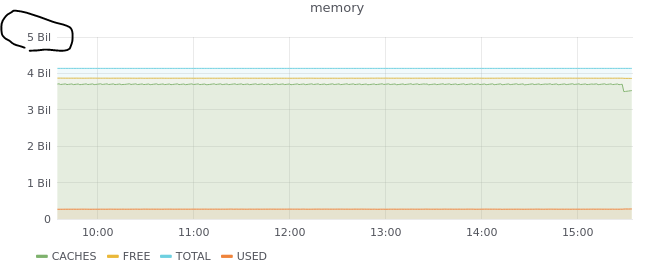
values in billion for memory and disk checks.
Hi Carsten! I got a new installation of icinga2, icingaweb2, grafana and your plugin: icinga2: 2.11 icingaweb2: 2.7.3 grafana: 6.5.2 icingaweb2-module-grafana: 1.3.6
Your plugin is working but I noticed that disk, memory, network checks etc, use the short values. There is no calculation like in megabyte for example.
So the memory graph looks like that:
 I tried to change that value in the icinga2-default panel from short to megabyte, but then all graphs have that calculation to megabyte.
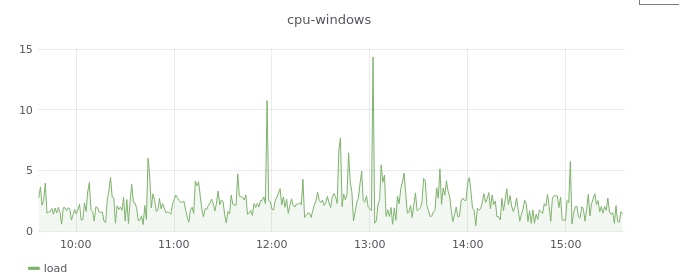
There are checks where the short value is perfect, for example the cpu check:
I tried to change that value in the icinga2-default panel from short to megabyte, but then all graphs have that calculation to megabyte.
There are checks where the short value is perfect, for example the cpu check:
 In grafana, I got a lot of dashboards with custom panels and custom values. My question is if it's possible to reference every single service check to a grafana dashboard and panel. And not referencing it to the default-icinga2 dashboard.
I hope you understand what I'm trying to say.
Thank you!
In grafana, I got a lot of dashboards with custom panels and custom values. My question is if it's possible to reference every single service check to a grafana dashboard and panel. And not referencing it to the default-icinga2 dashboard.
I hope you understand what I'm trying to say.
Thank you!
You can reference to whatever dashboard panel you want. You just need to configure it. Best Practise is to use command name for it, works for the most plugins.
Can you tell me where I need to configure this? So for example I would like to reference a memory check of a host to a specific panel of a specific dashboard. Is that possible?
I have read the docs 3x and still can't figure out how to pass in sensible "default units" so the Grafana graphs don't display in Billions, per the above. Is someone sufficiently knowledgeable able to provide a "how to" with steps please? This affects the human readability of most disk, swap and memory metrics.
- Create a dashboard with a panel in Grafana for the service/command ....
- Configure this dashboard/panel for the service/command inside the graph configuration of the module
Really simple
I must still be missing something here - I have built the dashboard in Grafana and tested it against 2-3 servers successfully within Grafana. When changing the
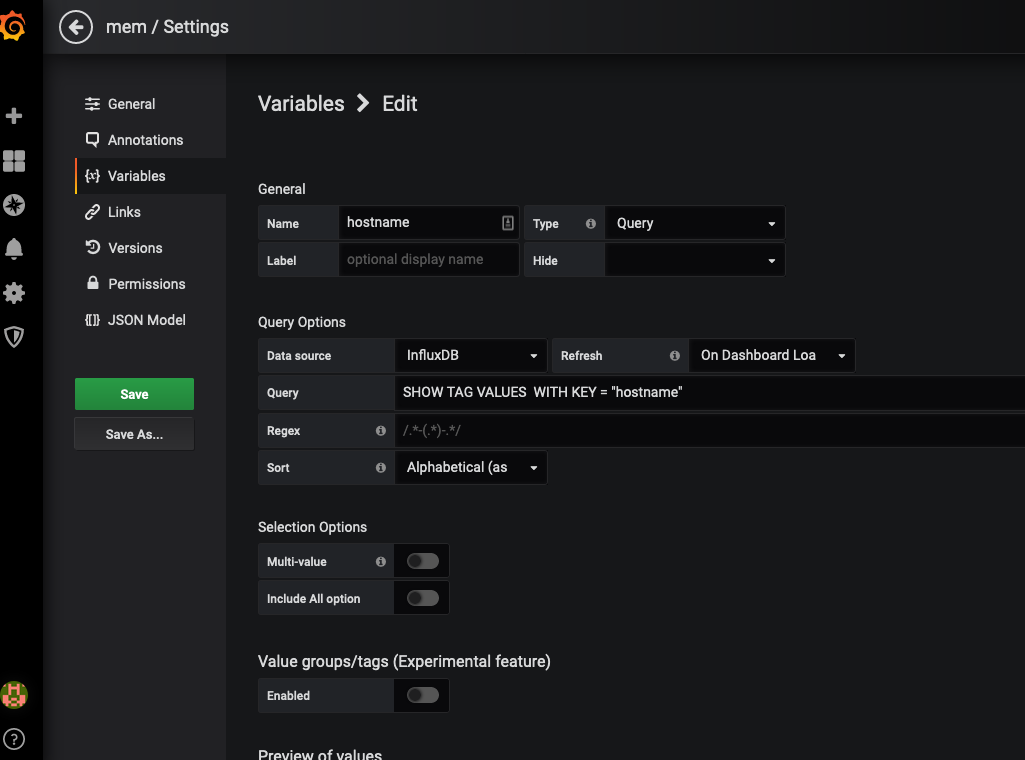
I have now resolved the above. Option 1: Edit the "base metrics" dashboard and add an additional panel (it already has the correct variables setup).
or
Option 2: Add the variables to the Dashboard (not in the Panel config I had been looking through).