icingaweb2-module-grafana
 icingaweb2-module-grafana copied to clipboard
Graphs of different sizes for one Service
Hello.
Is it possible to create graphics of different sizes for a single Service?
Expected Behavior
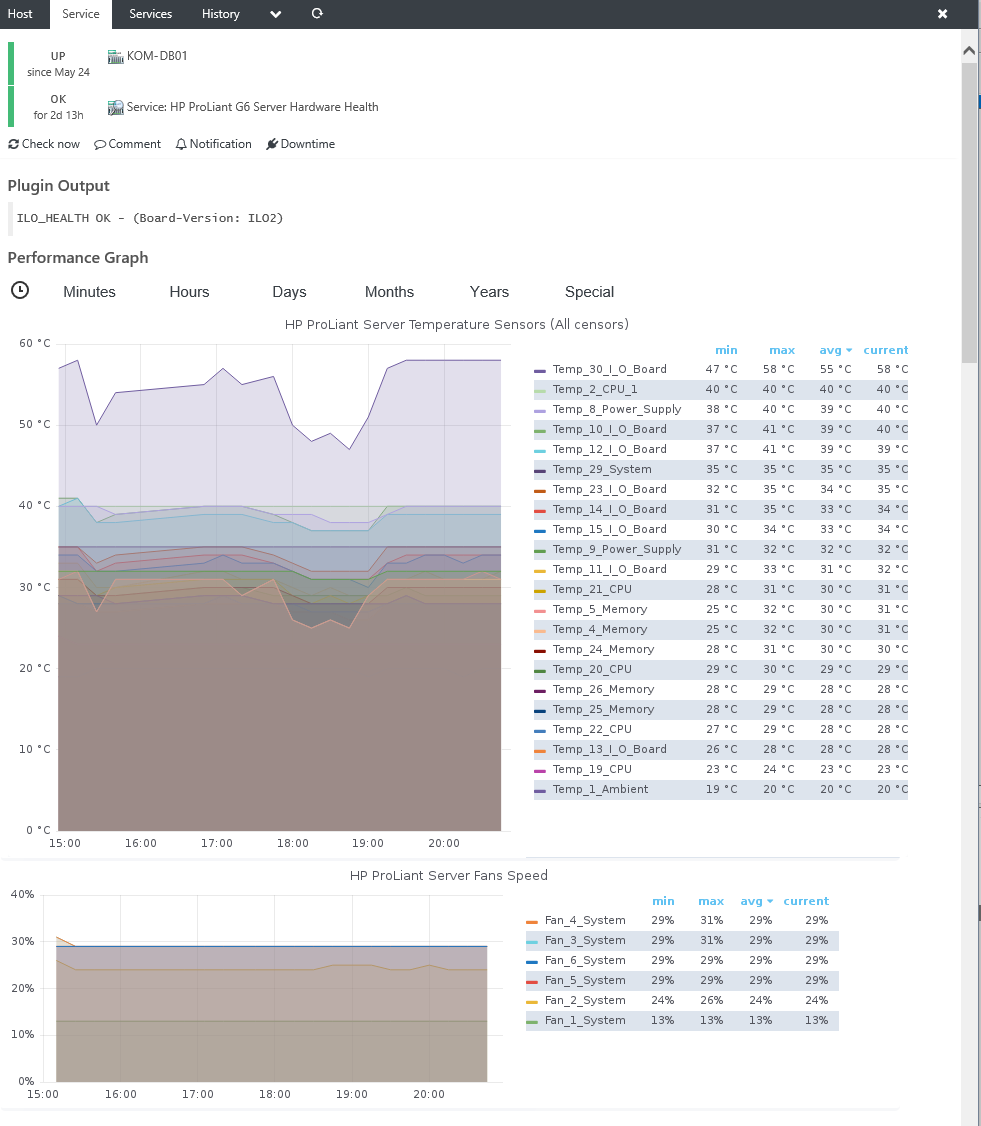
Displaying multiple graphs of different sizes for the same Service:
Current Behavior
All graphics have the same size. This is not always convenient.
Possible Solution
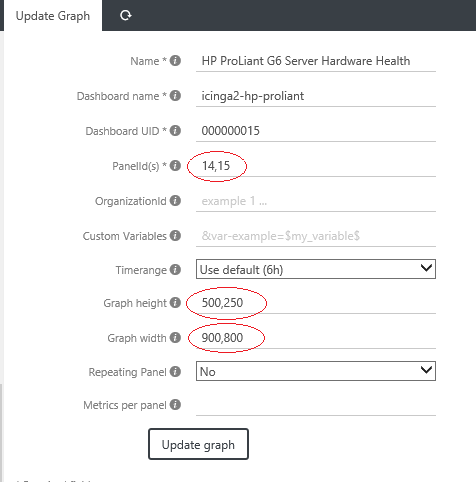
It is necessary to specify several values of the sizes of graphs.
Iam sorry thats not possible. I will leave this issue open, maybe i get an idea how to make this possible.
Just reading this again, why you dont have a single graph for every temperature group?
Just reading this again, why you dont have a single graph for every temperature group?
In my example, it is not possible to use one graph for all sensors, as this is logically wrong. Some of the sensors show the temperature, the other part of the sensors shows the speed of the fans.
Mission Impossible? :)
You can filter in your grafana panel with something like /^Temp.*CPU.*/ or /^Temp.*Memory.*/ and so on and trhen use multiple panels to show in the module
I do. But all charts in Icinga are the same size, and this is very inconvenient. Because one graph can have 20 metrics and another graph can have 2 metrics. And these graphs should have different sizes. That's what I wrote about in my first post.